

Environmental scientists use three fundamental tools to assess safety: risk assessment (predicting health impacts from contamination), environmental measurement (sampling and laboratory analysis), and comparison to regulatory standards. These methods help answer critical questions about pollution safety, water supply security, and energy sustainability. While general environmental quality continues improving in the United States, specific challenges remain in chemical product safety, groundwater depletion, and transitioning from carbon-based energy sources.
When I hear this question, I think of Lawrence Olivier in Marathon Man probing Dustin Hoffman's teeth to make him reveal the diamonds. Today I'm repeating the question, hopefully without the toothache.
Albert Einstein said, "The environment is everything that is not me." Actually, "me" is definitely part of the environment. It took us a while to understand that, and I will explain the tools we use to get there so you all can explore three of the most important questions about us and our environment:
- Are we safe from pollution?
- Is our water supply safe?
- Is our energy supply safe?
The answer to each of these questions is "probably" (did you really expect certainty?), although major changes for water and energy are likely. We'll come back to this later.
Jump to Section
- Environmental Challenges
- Environmental Basics
- Environmental Tools
- Standards and Criteria
- Are We Safe From Pollution?
- Is Our Water Supply Safe?
- Is Our Energy Supply Safe?
- Frequently Asked Questions
- Key Takeaways
- Summary
I was an environmental engineering consultant for 45 years. I started my career just after the first Earth Day, and I have worked on essentially every type of environmental issue there is. My specific expertise is water quality, and I spent the last 30 years of my career working on hazardous waste sites. I used the tools I'm about to tell you about every day.
Environmental Challenges
Before we get started on the tools, I want to point out some questionable decisions we've made and how forgiving our environment has been.
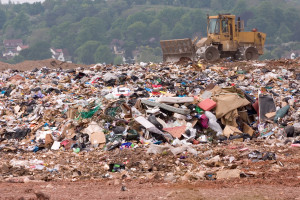
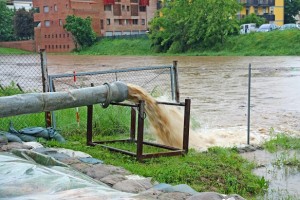
For starters, consider waste. The United States discharges about 32 billion gallons of wastewater every day. That's more than one Lake Erie every day. We dump about 250 million tons of garbage per year. That's Rhode Island 2 feet deep every 10 years. It was worse in the past, but now it's improving, as is our environment.
To date, waste and waste disposal have been necessary, but some other things we do are not.
Building Cities in the Desert
I worked on a project in Phoenix once where I noticed the city's 500-foot deep groundwater supply wells were designed to draw water beginning from 40 feet below the ground despite groundwater currently found below 400–500 feet in some areas. This well-designed seemed unnecessarily expensive, so I asked why they did it that way. The answer was because groundwater was at 40 feet when the wells were installed. Phoenix has "mined" over 400 feet of its groundwater. Groundwater "mining" is a term used when more groundwater is used than can be replenished. People in Phoenix have lush lawns and clean their driveways with garden hoses. Is this sustainable?
Las Vegas is spending a billion dollars on a new water-supply intake at Lake Mead because the lake level has dropped more than 180 feet since 2000, and the old intakes will be above water.
California cities rely so much on the Colorado River for water supply that this once mighty river now merely dribbles into the ocean.
When it finally does rain in California, building development has denuded the fragile desert so much that the rain brings devastating mudslides.
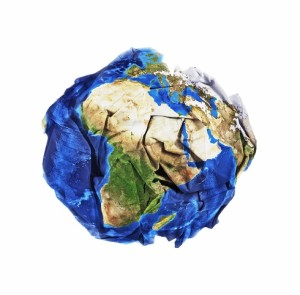
Two hundred years ago, when we founded our desert cities, our footprint was small enough so that we could muscle the environment to our will. But how long can we sustain life in these deserts now that our footprint has grown?
Learn more about how to become a groundwater protection specialist.
Nuclear Waste
Our 60 nuclear power plants in the US generate 2,000 tons of radioactive waste per year. We have no permanent repository to safely dispose of this waste.
Ozone Hole
This is a good story. Stratospheric ozone shields us from deadly cosmic radiation. Without it, life on earth would not be possible. (Ironically, ozone at ground level can kill us.)
In the spring of 1985, we discovered a thinning of the ozone layer over 7 million square miles of Antarctica. Subsequently, this "hole" expanded to 11 million square miles.
The problem was tracked down to our use of Freon-type chemicals. In 1987, 193 nations signed the Montreal Protocol to phase out production of these chemicals.
Noticeable ozone layer recovery began in the early 2000s. Recovery is slow, however, because these destructive chemicals can linger in the atmosphere for a hundred years. But it seems we dodged a bullet. World cooperation was key, and I believe it was only possible because the solution was not disruptive. Conversely, climate change solutions would be disruptive, and the prospect of world cooperation looks pretty dim.
Climate Change
Climate change is complex and controversial. Some think it's not true, although 97–99% of actively publishing climate scientists agree that climate change is human-caused. Time will tell; let's consider just a few facts so you can form your own conclusions.
Carbon dioxide is a greenhouse gas meaning it traps heat on earth, preventing its radiation back out to space. Most excess carbon dioxide in the air is from burning carbon fuels, although making cement contributes 10%. Atmospheric carbon dioxide reached 400 ppm in 2014 for the first time ever. (I'll tell you what a "ppm" is in a moment.) In 1960, atmospheric carbon dioxide was about 320 ppm; by 2014, it was 25% higher. Although the earth seems to have 100,000-year cycles whereby carbon dioxide ranges from 200 to 300 ppm, and there are also shorter-term natural variations, there is no question that carbon dioxide in 2014 was on the rise beyond Earth's historical cycles.
We know these concentrations from direct measurements in modern times and from measurements in ice cores representing over a million years of history.
A "ppm" is a unit of concentration that stands for "parts per million," typically on a volume basis for air but on a mass basis for water. So for air, 1 ppm is like 1 balloon of carbon dioxide mixed among a million balloons of air. Personally, I hate this nomenclature and prefer a more scientific term, such as "milligrams per cubic meter," but many people seem to prefer the "parts per…" nomenclature.
The earth's temperature is also on the rise—about 1.1�C since the late 19th century to about 58 degrees Fahrenheit on average. Doesn't seem like much, you say? This small change has caused Greenland's ice shelf and glaciers worldwide to recede (melt) in some cases by more than a mile. That's a fact.
Sea level has been rising about 0.13 inches (3.3 mm) per year since 1993. That's another fact. Small, you say? The Economist reported (January 17, 2015) that experts predict that $100 billion in US real estate will be underwater by the end of the century. A warming earth causes the oceans to expand, and melting ice creates more water.
"Heat of fusion" is a scientific principle that is important for the earth's ice. It takes 1 calorie to heat 1 gram of water 1 degree, but the phase transition from ice to water takes an additional 80 calories without any temperature change. That's called water's heat of fusion. This means that once ice is melted, it will take a lot of cold (absence of heat) to get it back. Making new ice caps will be like putting the genie back in the bottle. In addition, once the ice melts, additional heat will make temperatures soar.
The oceans absorb carbon dioxide from the air. Optimists hope this will take care of the excess. No one knows yet.
These are indisputable facts—atmospheric carbon dioxide is the highest ever, temperature is rising, and the ocean is swelling. Skeptics' primary argument about these facts is that they are simply natural variations. Almost all scientists disagree, arguing that these changes are beyond normal. But forget that part of the debate. Whether they are natural or man-made is not important at this point. The important point is how they will affect our environment. No one knows. Some models predict that ocean currents, such as the Gulf Stream, which pumps heat from the equator northward, will stop and cause an ice age. Other models predict extreme weather—wet will get wetter and dry will get drier—and changes in agriculture. But today, the causes and effects of climate change remain fuzzy, so the political world is neither willing nor able to come to grips with precautionary action. So instead of "prevention," most strategies today focus on "adaptation." But how much adaptation will be required? What will life be like? No one knows.
Landfill Black Holes
Although this might fit more into the category of "scary" than "questionable decisions," I want to tell you a story about just one landfill that closed around 1990. I worked on this landfill in California. Because it wasn't built with the right safeguards in the first place (there were no such regulations when it opened), the operation and maintenance budget for this landfill is currently about $25 million per year. Just one landfill. Some of that budget is for studies on how to improve things, but it is unclear to me that the landfill really poses a risk, despite the millions of gallons of waste in it. The real point of concern is the $25 million per year operating cost for a closed landfill. Multiply that times all the other landfills that might need such annual spending, and you realize how little money we have left over for other environmental needs.
Environmental Basics
Despite such gloom and doom, I have repeatedly been amazed at the environment's resiliency. And the better we measure it, the better we understand and can manage our part in it.
So how do we consider the environment? The environment might be described broadly as air, water, and soil in both outdoor and indoor settings. Outdoor and indoor air, water, and soil are called "media." Indoor "soil" is more commonly called "dust" unless you live in a pig pen, of course. Acting on these media involves all kinds of chemistry, physics, and biology.
We are the only part of biology that can destroy it all, but there are many other forms of biology playing important roles in our environment, including bacteria, algae, ants, and trees, among others. All this biology is affected by four important factors of chemistry and physics: oxygen, enzymes, energy, and toxicity.
Oxygen
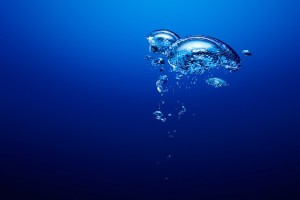
Oxygen plays a central role in the environment. Aerobic organisms, like us, fish, and many bacteria, need it to live, while anaerobic organisms die from it. Most of the world's healthy ecosystems are aerobic, but two important anaerobic microbial reactions that occur under your nose are fermentation and digestion. Healthy water has about 9 mg/l of oxygen dissolved in it, and fish love that. Our understanding of dissolved oxygen in water began in 1888, when Ludwig Winkler developed a convenient method to measure it. In 1925, another great leap occurred when two US Public Health scientists, Streeter and Phelps, developed a model describing the balance of oxygen in streams caused by decaying pollution and atmospheric reaeration.
From those two eurekas came our entire science of sewage treatment and surface water management. There are 16,000 sewage treatment plants in the US, all treating and discharging sewage at levels prescribed by this science and regulated by the US EPA, so that acceptable water quality is maintained in most of them. As described later, wastewater discharge limits are based on what we call "waste load allocation" calculations using versions of the Streeter and Phelps model, while microorganisms mop up the rest in a process we call "natural purification," also based on the principles described by Streeter and Phelps.
When too much waste is discharged into water, oxygen levels are depleted from its decay, fish can die, and nasty anaerobic microorganisms take over. The water becomes malodorous because those anaerobes spew out sulfur and ammonia.
From the early 1900s through the 1970s, our rivers and lakes were headed for real trouble. Population growth led to excessive waste discharges, putting too much pressure on natural purification systems. There was little wastewater treatment and much to learn about pollution. Water-borne diseases from sewage, such as typhus and dysentery, were rampant, and rivers even caught on fire. Lake Erie was dying, meaning detergent-laden phosphorus-engorged algae blooms decayed and depleted the lake's oxygen. That process is called eutrophication. After decades of debate and improved scientific understanding, the US finally established a federal law, the 1972 Clean Water Act, which turned the tide.
Water-borne typhus is now a thing of the past, and more and more miles of rivers and acres of lakes are becoming swimmable and fishable again. Our waters are becoming healthy with oxygen.
Enzymes
Enzymes are chemicals in plants and animals that facilitate chemical reactions. It is amazing how so many things would not happen without enzymes. Most of these enzymes exist in microorganisms, which can be viewed as little chemical reaction factories. Sewage treatment and natural purification of receiving waters are two examples of critical microbially mediated enzyme reactions. For example, one of the most common processes for sewage treatment is called the "activated sludge" process. In this process, we let bacteria and fungi grow rampantly in tanks we feed with sewage and air. This "activated sludge" of microorganisms then breaks down waste molecules through enzymatic reactions much more efficiently than we could with man-made chemical reactions.
Enzymes also play a role in algae's creation of oxygen and in forming the base of the food chain. Enzymes also play a role in microorganisms taking nitrogen from the atmosphere and converting it to forms of fertilizer. Our environment would not be hospitable to humans without enzymes.
Energy
Energy plays a fascinating role in the environment because it both hurts and helps. Radiation energy can kill, but energy can be used to desalinate life-giving water. Engineers use a tool called mass and energy balances to describe almost everything. These are equations based on the notion that mass and energy are never created; they just change forms.
Mass and energy balance analysis has been useful to learn how the environment works. Entire ecosystems are thus described by tracing the energy flow from sunlight through primary production (e.g., algal growth) to primary consumers (e.g., bugs that eat algae) to higher consumers, all the way to the top, such as sharks in the ocean, and back through scavengers and degraders. In Watergate, we followed the money; in Water, we follow the energy.
Toxicity
Everything is toxic at some level. To quote Paracelsus, a 16th-century rogue, "the dose makes the poison." Toxicity is important to the environment for two reasons: human health and the functioning of environmental processes. For example, toxic chemicals in discharged wastewater might prevent the bugs in a stream from doing their job in natural purification. For the former —human health —I will describe our first tool for environmental analysis: risk assessment.
Environmental Tools
Risk assessment was first formalized in the 1980s when the federal Superfund law started cleaning up hazardous waste sites. Recognizing that zero contamination was neither practical nor necessary, we needed to predict how much contamination was tolerable, and risk assessment became the tool to do so—with it, we could ask: how clean is clean enough? That question was the crux of my career. Is it safe?
Today it is routine for environmental scientists to consider the safety from contamination using human health risk assessment and ecological risk assessment. The latter name is actually a misnomer because ecological risk assessment examines only selected organisms, not ecosystems, using human health risk assessment methods.
Although there are more complicated definitions, the simplest way to think of human health risk assessment is in three parts: to the body, into the body, and inside the body. Predicting how contaminants reach the body is a field called "fate and transport." Predicting how much enters the body is a field called "exposure assessment." Predicting what happens when a contaminant is in the body is a science called toxicology. Exposure assessment is a combination of posing "exposure scenarios"—how many times a week someone takes a shower and for how long, for example—as well as assigning exposure factors, such as how much chemical gets absorbed through skin, for example.
Fortunately, we don't have to make this stuff up every time we analyze it. There are regulatory guidance manuals on exposure factors and the overall risk assessment methodology. EPA maintains a database of toxicity factors, now available online, called IRIS (Integrated Risk Information System). More on IRIS, later. The science of "fate and transport" is perhaps the most complex part, but it is based on well-defined engineering principles, such as chemical solubility and fluid transport mechanisms, and on mathematical models that enable the calculation of complex cause-and-effect processes. With this science, we predict concentrations at locations of interest distant from a contaminant discharge point, i.e., a "source." I will spare you further details if you will spare me from snoring. Just rest assured that risk assessment calculations are reproducible, defensible from scientific research, and are usually reviewed for reasonableness and accuracy by peers or regulators.
Perhaps the best way to explain risk assessment further is to demonstrate it with a simple example. Consider a waste discharged into a river used for drinking water.
Fate and Transport Analysis
I must determine what chemical contaminants are in the waste. I must then determine the concentrations of those chemicals at the water supply point. To do this, I need to know how much chemical is discharged and how it dilutes. Then I must consider possible transformations, such as chemical reactions or microbial effects. Then I must consider phase changes, such as attachment to particles that are removed by sedimentation or to volatilize into the atmosphere. After considering all of these processes, I can predict the concentration of each pertinent chemical at the drinking water supply point.
Exposure Assessment
The exposure analysis predicts the dose. "Dose" is the amount of contaminant that gets inside the body.
First, I pose all the possible exposure scenarios. In this simple example, two exposure scenarios will be considered: drinking water and showering. I will ignore others, like getting water on your hands while washing your car. These others are probably minor, and you've got to draw the line somewhere.
For each exposure scenario, I must assign exposure factors. For example, a standard assumption for the drinking water consumption rate is 2 liters per day. For the shower scenario, I must specify how long the shower lasts, how often we shower, etc. Going back to fate and transport analysis, I must also predict how much contaminant volatilizes during the shower. For the shower scenario, I will consider inhalation but ignore dermal absorption.
The dose result is the mass of contaminant entering the body, grams per day per kilogram of body weight, for example, through each pertinent "exposure route," such as ingestion, inhalation, or dermal absorption.
Toxicity Analysis
Risk is calculated by multiplying the dose by a toxicity factor. Two kinds of health effects are evaluated, cancer and noncancer (e.g., kidney disease), and different toxicity factors exist for each "endpoint." How risk is expressed will be explained shortly.
Toxicity factors are developed in the laboratory by exposing lab animals to various doses and noting their health effects. Using scientific knowledge about toxicity and after applying safety factors to account for the fact that most people are not rats, these results are translated into human toxicity factors.
EPA uses what its scientists consider the best-developed toxicity factors and maintains them in a constantly updated online database called IRIS, as mentioned earlier.
It is possible to challenge IRIS values and some contaminants are not in IRIS, both of which would require a toxicologist's expertise, but in most cases, this part of risk assessment is merely looking up appropriate values in IRIS. More or less monkey work.
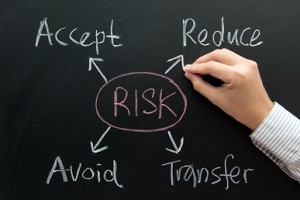
Cancer risk is expressed differently from noncancer risk. Cancer risk is expressed as an incremental probability of getting cancer from the exposure—"incremental" meaning above and beyond other daily cancer risks. Non-cancer risk is expressed as a ratio against a level considered safe. This is called a "Hazard Quotient." When evaluating more than one contaminant, these Hazard Quotients are summed, provided they apply to the same health effect, to form a "Hazard Index." A Hazard Quotient or Index less than 1 is considered safe because it is less than what is considered a safe level. A cancer probability is a little trickier because it is subjective. Our everyday risk of cancer is about 1 in 3. So, what additional cancer risk due to the contaminant exposure is tolerable? For Superfund sites, EPA says 1 in 10,000, and after a cleanup, incremental risk must be no larger than 1 in 1,000,000. Comparing this regulatory threshold to the 1 in 3 risk we all face from other causes, one can see that we are tolerating very little risk from hazardous waste sites.
As an aside, you should know thatthe EPA's advisory safe level for radon in your home is slightly higher than its threshold for action at Superfund sites. Said another way, EPA may require a multimillion-dollar cleanup at a Superfund but advises you that the same risk is ok in your home.
The regulatory world generally considers safety to be within a risk range of 1 in 1 million to 1 in 10,000. To put this in perspective, here's a comparison of daily event risks:
| Risk Type | Probability | Comparison to Superfund Thresholds |
|---|---|---|
| Being struck by lightning | 1 in 15,000 (lifetime) | Higher than Superfund action level |
| Dying in a car accident | 1 in 100 (lifetime) | Much higher than Superfund action level |
| Dying in an airplane crash | 1 in 11 million (lifetime) | Lower than Superfund cleanup goal |
| Superfund site action threshold | 1 in 10,000 | Regulatory decision point |
| Superfund cleanup goal | 1 in 1,000,000 | Post-remediation target |
Although risk assessment is a valuable tool, it is important to recognize that it often overestimates risk under current practice. IRIS toxicity factors include built-in safety factors, sometimes up to 1,000. Exposure scenarios are usually overly extreme. For example, I once worked on a Superfund site where the regulators required us to consider a 1-year-old infant's exposure to PCBs in sediments 4 feet deep. Resisting, I argued that the infant's health problem in that scenario would not be PCBs. EPA rules require postulating what is called a "Reasonable Maximum Exposure" (RME). Generally, there is little that is reasonable about what is required to consider.
What all this means to you if you find yourself in a potential exposure situation is that the calculated risk number is probably much higher than what you will experience, and you need to consider if the exposure scenarios posed in the risk assessment apply to you.
One last point I'll make about risk assessment is one that bugged me for the 25 years that I ran a risk assessment consulting firm. In Superfund and other regulatory programs, we make decisions based on estimated risk. It should be risk versus benefit. Risk-benefit analysis is a basic tool that I learned in engineering school. We all make risk-benefit decisions daily. For example, we usually decide that the benefits of driving our cars outweigh the risks of a car crash. Although a one-sided risk-only analysis might be appropriate for examining existing conditions (we call this a "baseline risk assessment"), a risk-benefit analysis is most appropriate for deciding what to do. This is not currently done properly in Superfund, and I believe a lot of money is wasted as a result.
Now you know how to think about contamination. The next tool is about how we measure it.
Measurement
There are two steps to measuring environmental contamination: sampling and analysis.
The key to good sampling is to ensure it is representative. Generally, we take a few bottles of stuff, soil or water, for example, and expect it to be representative of a large area or a long period of time. There are textbooks on how to do this properly, both in terms of the appropriate number of samples and their placement. Random, grid, and targeted sampling are three of the textbook strategies.
One thing to keep in mind for sampling is whether the same contaminant of concern is present due to other causes. We call this "background." Ignoring it can be misleading and expensive. Years ago, at Love Canal, a frenzy was triggered when indoor air benzene levels were ignored due to background gasoline emissions from a motorcycle repair in the basement.
After collection in the field, samples are sent to a laboratory for analysis. Labs have sophisticated instruments for this, such as gas chromatographs, mass spectrometers, atomic absorption spectrometers, and inductively coupled argon plasma spectrometers, to name a few. Samples are prepared and analyzed using these instruments under strict quality-control procedures prescribed in detailed methods published by regulatory agencies and trade groups.
Now we have the data, but don't take the results at face value. There are many reasons environmental data might not be accurate or precise. I spent much of my career dealing with this issue and offer two rules of thumb: results are never exact, but for good data, they are close; high values are close enough, but values close to the detection limit may be very wrong in a relative sense.
When I'm out of thumbs, I usually assume environmental data are good within a factor of 2.
Standards and Criteria
Measurement tools allow us to define contamination, and risk assessment is the tool to interpret what it means. A more generally applicable interpretation tool is to compare concentrations to criteria and standards. Standards are enforceable regulatory numbers. Criteria are suggestions based on the pertinent science. Both are often derived using risk assessment.
The United States has standards and criteria for many environmental media we encounter every day.
For drinking water safety, EPA maintains a list of MCLs, "Maximum Contaminant Levels," for dozens, perhaps hundreds of compounds or parameters (e.g., radioactivity or bacteria) in publicly supplied drinking water. In addition, there are testing and reporting rules for every such water supply. Water districts over a certain size must make those testing results available to you annually.
For air quality, EPA maintains air quality standards (NAAQS, National Ambient Air Quality Standards—the environmental field is full of acronyms, but nowhere near the Navy's lexicon) for 6 "criteria pollutants"—lead, particles, sulfur dioxides, nitrogen dioxides, carbon monoxide, and ozone in ambient air, along with rules for measuring them throughout the US. These are the most important general air quality parameters that influence smog, acid rain, and overall health effects. In addition,the EPA regulates emissions from potential sources of 189 Hazardous Air Pollutants (HAPs) that might have specific health effects.
For water quality in lakes and streams, the EPA maintains a list of ambient water quality criteria, and states offer quality standards for targeted stream classifications. Also, all wastewater discharges are regulated so as to ensure that stream standards are met. This is done through a program called NPDES (the National Pollutant Discharge Elimination System), which requires a permit for every pipe in the US discharging to a receiving water. Contaminant limits are customized for each pipe source based on the needs of the receiving water quality. Receiving water quality is defined for each water body in the US, including groundwater, by agencies assigning a classification to each. Classifications, which are usually designated alphabetically ("A, B, C, etc."), define the water quality goal for that water, such as drinkable, fishable, contact recreation, and, in some cases, even limited to waste conveyance. EPA's permit program for point-source pollution, i.e., from industries and municipal sewage treatment plants, is quite mature and sophisticated. Its permit program to control non-point sources, such as stormwater runoff, is technically more difficult but is improving every year.
So, to determine whether we are safe from pollution, environmental scientists measure pollution, assess its fate and transport, evaluate its potential health impacts, and compare it to standards and criteria, all while accounting for the myriad factors that complicate interpretation. Now let's get back to that question: Is it safe?
Question 1: Are We Safe From Pollution?
Most likely, yes.
The water we drink, the air we breathe, and our rivers and lakes all have their quality regulated in one way or another. One US debate in the early 20th century was whether to allow unfettered waste discharge, offset by strict drinking water treatment regulations, or to regulate waste discharges to protect drinking water supplies. We pretty much went with the first route because of the widespread adoption of chlorination until the 1970s, when we realized we needed both discharge regulation and strict water-supply regulation and treatment just to keep up.
Environmental quality regulations are based on the most recent, credible scientific analysis. Sometimes, new scientific understanding demands an update to a standard. For example, in 2008, the air quality standard for lead decreased from 1.5 to 0.15 ug/m� after a debate lasting over a decade. These debates aim to balance scientific research with safety, costs, practicality, and an appropriate margin of safety. Rarely is the path clear.
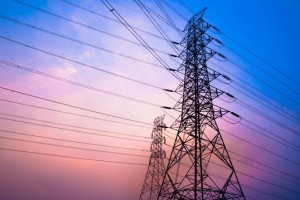
I believe our overall environment is safe, but there are some specific potential threats worth further consideration. Radon in homes, even at low levels typically found in homes, can cause lung cancer. Electromagnetic Fields (EMF), such as those from high-voltage lines, remain uncertain. The jury's still out, but this is unlikely to be a serious risk in most cases. Interestingly, having your bed against a wall with a refrigerator on the other side might offer the largest risk.
Chemicals in products are, in my opinion, the most important risk of contamination in most people's lives. Look at the labels on your cleaning products, and you will see up to 99% "inert ingredients." That means 99% is inert for the purpose of the product, but not necessarily for health effects. Chemicals in both cleaning and personal care products volatilize into your home's air and absorb through your skin, but no one regulates or even evaluates these potential risks.
In my opinion, chemical product safety is the last frontier for "the environment," and it's a big one.
Question 2: Is Our Water Supply Safe?
Water For People, a charitable organization, claims that several billion people worldwide spend 4 to 8 hours a day just getting water. Fortuitously, the US doesn't have this problem, even though we use 350 billion gallons per day of fresh water (across agriculture, industry, and domestic use), 21% of which comes from groundwater and the rest from surface water.
Here are some interesting statistics for our US water supply as of 2010:
| Water Use Category | Volume/Metric | Notes |
|---|---|---|
| Domestic use | 28 billion gallons/day | 87% from public supplies, balance self-supplied |
| Lost to leaks | 14% of domestic supply | Significant infrastructure challenge |
| Toilet use | 27% of domestic | Largest single domestic use |
| Washing | 22% of domestic | Clothes and dishes |
| Showers | 17% of domestic | — |
| Faucets | 16% of domestic | — |
| Average daily per capita usage | 88 gallons | Down from ~160 gallons when I started my career |
| California total use | 40 billion gallons/day | About 60% for irrigation |
| Texas use | 25 billion gallons/day | Second highest state |
| Florida use | 15 billion gallons/day | Third highest state |
| Rhode Island use | 0.2 billion gallons/day | Lowest state |
| Water reuse | 3 billion gallons/day | NRC estimates up to 30 Bgd could be reused |
| US desalination capacity | ~10% of global (21 Bgd) | Energy-intensive process |
Water withdrawals (fresh and saline combined) grew from 180 billion gallons per day in 1950 to 420 billion gallons per day, teetered around that level until 2005, and have declined to 355 billion gallons per day in 2010. During this time, the US population doubled from 150 million to 300 million, so various efficiency measures were effective.
Desalination is not the "get out of jail" card you might believe because it costs energy. It takes about 1 kWhr to desalinate 100 gallons of seawater. MIT is working on a new desalination membrane that produces energy as a byproduct.
In general, the water picture for the rest of the world is different from that of the US. Some of this is out of local necessity:
| Country | Water Reuse % | Context |
|---|---|---|
| Israel | 70% | Of domestic wastewater |
| Singapore | 30% | Of domestic wastewater |
| Saudi Arabia | 16% | Of domestic wastewater |
| Australia | 8% | Of domestic wastewater |
| United States | ~2% | 95% in CA, FL, TX, AZ |
Saudi Arabia has the largest desalination capacity at 3 billion gallons per day, with the Middle East overall at about 6.5 billion gallons per day, or 30% of the world's total.
Globally, water consumption has tripled over the past 50 years. This is partly due to population growth but also to development. The lack of supply infrastructure and poor water quality threaten many developing countries.
So, what about the second question: will there be enough water? A precise answer is not possible because it depends on how development occurs in the future and on energy, which I will discuss next. Future water wars are possible, but not inevitable. Let's explore the question by considering three developing nations: China, Nigeria, and Saudi Arabia.
China's Water Crisis
China is roaring with modern development, and its water supply issues are severe as a result. China needs 146 trillion gallons of water per year—12% domestic, 65% agriculture, and 23% industry. China is mining groundwater in 160 areas, totaling 2.6 trillion gallons per year. As a result, 50 cities suffer from land subsidence.
80% of China's water resources are in southern China, which is not aligned with its needs. A north-south water transfer project is underway. Pure muscle. China depends on some water that originates in, and may therefore be "owned" by, other countries, including Tibet, Vietnam, Cambodia, India, and Russia.
Extensive infrastructure projects, including supply, water quality, desalination, and water reuse, are underway in China. Still, 300 million people in China have no access to clean water. 60% of China's surface water is so polluted it cannot be used for water supply. About 400 of China's 660 or so cities face water shortages, including 30 of its 32 largest cities.
Beijing needs 2.6 billion gallons per day but has safe supplies of only 1.5 billion gallons per day. Beijing uses twice as much water per capita as Melbourne, Australia. Clearly, water conservation will be part of China's future.
Bottom line, China has strong infrastructure capabilities but severe water-supply issues due to population growth and development. Depending on internal fixes, China's future may include conflicts with its neighbors about water.
Nigeria's Infrastructure Challenge
Nigeria should be a benchmark for the developing African continent, due to its oil wealth, but it has an abysmal water supply. Access to improved water is only 50% in rural areas and 75% in urban areas. 80% of government water supplies in small towns are non-operational.
Lagos, Nigeria's largest city with a population of 12 million, has a water supply of only about 150 million gallons per day. (At the US average of 88 gallons per capita per day, this would mean 14% of the population is served.)
The water is there. Nigeria's daily water replenishment to surface and groundwater is 220 billion gallons per day. With proper management, much of this could become a sustainable water supply. Nigeria's population is 174 million, so this supply potential could easily support an equivalent to today's US average. But it's not happening.
Bottom line, Nigeria's problem is infrastructure. Even if it wanted to fight about or steal water from its neighbors, it couldn't supply it to its people. Many developing nations are in the same boat.
Saudi Arabia's Energy-Dependent Solution
Saudi Arabia has only 24 million people, but it is a rich desert nation that can easily buy its water and distribute it to its people. Saudi Arabia has no permanent rivers or lakes and hardly any rainfall. Much of its water supply comes from groundwater and desalination.
About 50% of drinking water comes from desalination, 40% from groundwater mining, and 10% from intermittent surface water in the mountainous southwest. Some groundwater aquifers have dropped by more than 450 feet over the past 25 years. The Saudi government operates 27 desalination plants generating 3 billion gallons per day.
Municipal water use is 1.5 billion gallons per day, 9% of total (another 88% goes to agriculture). Water reuse and conservation have decreased new water demand by up to about 40%. Water rates in Saudi Arabia are about $0.40/1000 gallons. Compare this to Boston's rate of $6.50/1000 gallons and to $ 4 per 1000 gallons for desalination. Clearly, the Saudi government is subsidizing water costs.
From 1975 to 2000, Saudi Arabia invested $100 billion in water supply and sanitation infrastructure, 1.5% of GDP, among the highest relative spending in the world. In 2010, it was spending $2 billion per year.
Bottom line: Saudi Arabia, one of the world's scarcest water zones, supplies water almost for free. It can do this, relying heavily on desalination, because it is energy-rich. But can this country and other governments that subsidize water do it forever?
These current examples span a range of conditions and suggest a future that will vary depending on local conditions, including possible conflict, poor distribution limiting growth, possible community collapse after subsidy collapse, and buying out of problems with excessive energy.
This brings us to our third question.
Question 3: Is Our Energy Supply Safe?
Saudi Arabia is a perfect example of the inextricable connection between water and energy. For many countries, a future with energy problems will mean a future with coincident water problems. Whether life can be sustained in such countries remains to be seen, but globally, water-rich countries may be left only with energy problems. And there will be energy problems.
First a lesson on units of energy. Today we talk in Quads. A "Quad" is a quadrillion BTUs. A BTU (British Thermal Unit) is a basic unit of heat, which is a form of energy. The US uses 95 Quads of energy per year. In 1980, it used 75 Quads. Another basic unit of energy is electricity in terms of "Kilowatt-Hours (kWhr)." Converting all of its energy forms into this unit, the US uses 28 trillion kWhr per year. My house uses 4 billionths of a percent of this.
The world uses about 530 Quads per year. There are about 9,000 Quads of proven oil reserves, 6,600 Quads of natural gas, and about 18,000 Quads of coal reserves. At the current consumption and proven reserves, this gives about 63 years of carbon energy. Let's more than double that to 150 years to account for unproven reserves. That's our carbon energy future, 150 years, ignoring growth and climate change.
After our carbon energy is used, there are two likely replacements—nuclear and renewables. For the latter, let's eliminate bio. If all the annual production of biomass in the world were converted to energy, it would satisfy about 20% of the world's energy needs and leave us with no food. That leaves primarily solar, wind, and water power.
In 2011, 9% of US energy was supplied by renewables—1% by wind, 0.2% by solar, 3% by hydroelectric, and 2% by wood, among others.
If hydroelectric is about as developed as it's going to get, that leaves solar and wind for our renewable energy future. Let's consider solar (photovoltaics) first.
About 2 million Quads of solar radiation hit the Earth each year. That's 4,000 times more than we need for the world, or 1,200 times based on the sun hitting just land. Solar panels operate at about 15% efficiency. Let's hope for 30%. At this higher efficiency yet to be achieved, 600,000 Quads or 1,000 times our needs are available if we covered the entire earth with solar panels, 300 times on just land. Said another way, to satisfy all the world's energy needs, we would need to cover 200,000 square miles with solar panels.
A typical solar panel is 18 square feet, so that would take 300 billion solar panels. I put 20 solar panels on my house for $35,000. So we are talking about a capital investment of $10 quadrillion for solar to satisfy the world's energy demand. That's 600 times the US GDP. If economies of scale saved us a factor of 10, that leaves a total cost of 60 US GDPs. Serious stuff. And we haven't even considered the practicality issues. Read more about solar power pros and cons.
Wind energy has its own unique requirements. Cape Wind, in my backyard, will cover 24 square miles of nearshore ocean with a rating of 450 Megawatts. (For comparison, this is about half the size of a nuclear power plant). At this potential for 6.7 billion kWhr, 110,000 square miles would satisfy the annual US energy demand. This is about the size of Colorado. Read wind power 101.
Despite these scary statistics, there is no question in my mind that solar and wind have a permanent place in our energy future. Nuclear power is probably the other piece. Nobody wants a nuclear power plant in their backyard, but new technologies are making them safer to consider. Current plants are nuclear fission-based—splitting uranium —and fusion—hydrogen to helium—which generates 4 times more power —is our hope for the future.
There are about 60 nuclear power plants operating in the US today. (They generate 2,000 tons of radioactive waste per year, and we have no permanent repository for dealing with this.) About 8% of US energy, 8 Quads, is currently supplied by nuclear power, but no new nuclear plants have been built in the US for about 20 years. A new, 1,000 MW nuclear power plant might cost $6 billion to build. Thus, it would cost about $12 trillion to convert the world to nuclear energy. Cheaper than for solar, but maybe not after we pay to manage the waste properly.
These examples demonstrate that there will be incredible costs and practical concerns about energy after carbon's demise. But what is our choice?
So let me finish by summarizing my thoughts on the three safety questions.
Frequently Asked Questions
What is environmental risk assessment?
Environmental risk assessment is a systematic process for predicting health impacts from exposure to contamination. It involves three main components: fate and transport analysis (predicting how contaminants move through the environment), exposure assessment (calculating how much contaminant enters the body through ingestion, inhalation, or skin absorption), and toxicity analysis (determining health effects using EPA's IRIS database). Risk assessment helps answer the fundamental question "how clean is clean enough?" by comparing calculated risks to regulatory thresholds typically ranging from 1 in 1 million to 1 in 10,000.
How do scientists measure environmental contamination?
Environmental contamination measurement involves two critical steps: sampling and laboratory analysis. Sampling must be representative of the area or time period being studied, using strategies such as random, grid, or targeted sampling. Scientists collect samples (water, soil, air) and send them to laboratories equipped with sophisticated instruments, including gas chromatographs, mass spectrometers, and atomic absorption equipment. Quality control follows strict protocols from regulatory agencies. One crucial consideration is "background" contamination—naturally occurring or unrelated sources of the same contaminant that could skew results if not properly accounted for.
Are we safe from pollution in drinking water and air?
Generally, yes. The water we drink and the air we breathe in the United States are regulated through comprehensive standards. EPA maintains Maximum Contaminant Levels (MCLs) for hundreds of compounds in drinking water and National Ambient Air Quality Standards (NAAQS) for six criteria pollutants affecting smog, acid rain, and health. Water quality has improved significantly since the 1972 Clean Water Act, with water-borne diseases like typhus now eliminated and rivers once on fire now fishable. However, specific risks remain: radon in homes, electromagnetic fields (though unlikely to be serious), and, most significantly, unregulated chemicals in household cleaning and personal care products that volatilize into indoor air or are absorbed through the skin.
Will the world have enough water in the future?
The answer depends heavily on local conditions and future development patterns. Water wars are possible but not inevitable. The US currently uses 350 billion gallons per day across all sectors, with efficiency improving (population has doubled since 1950, while total water use has declined since 2005). However, global water challenges vary dramatically: China faces severe shortages despite its infrastructure capability, with 60% of surface water too polluted for supply and 400 cities facing shortages. Nigeria has abundant water resources (220 billion gallons per day replenishment) but lacks distribution infrastructure. Saudi Arabia relies on energy-intensive desalination (50% of supply) and groundwater mining. Solutions include water reuse (Israel reuses 70% of domestic wastewater, compared with 2% in the US), conservation, and desalination, though the latter requires significant energy.
What will replace carbon-based energy sources?
Two likely replacements exist: nuclear power and renewables (primarily solar and wind). At current consumption, proven carbon reserves (oil, natural gas, coal) provide about 63 years, or perhaps 150 years, accounting for unproven reserves. Solar radiation hitting Earth provides 1,200 times our energy needs on land alone, but covering 200,000 square miles with solar panels at 30% efficiency would require massive capital investment. Wind energy similarly requires extensive infrastructure—110,000 square miles to meet the US's annual demand. Nuclear fusion (hydrogen to helium) generates four times more power than current fission plants but creates radioactive waste with no permanent repository. Despite challenges, solar, wind, and nuclear will likely combine to form our post-carbon energy future, though costs and practical concerns remain substantial.
What tools do environmental scientists use daily?
Environmental scientists rely on three fundamental tool categories. First, risk assessment methodologies, including fate and transport modeling, exposure scenario development, and toxicity databases like EPA's IRIS system. Second, measurement and sampling protocols using sophisticated laboratory equipment (gas chromatographs, mass spectrometers, atomic absorption instruments), following strict quality control procedures from regulatory agencies. Third, regulatory standards and criteria, including EPA's Maximum Contaminant Levels for drinking water, National Ambient Air Quality Standards for air, and water quality criteria enforced through the NPDES permit system. Additionally, scientists use mass and energy balance calculations, dissolved oxygen measurements, and mathematical models, such as the Streeter-Phelps model, which form the foundation of sewage treatment science.
How does climate change affect environmental safety?
Climate change creates multiple environmental safety challenges. Atmospheric carbon dioxide reached 400 ppm in 2014 (25% higher than 1960 levels), contributing to a temperature rise of about 1.1�C since the late 19th century. This seemingly small increase has caused Greenland's ice shelf and global glaciers to recede by over a mile in some cases, and has raised sea level by about 0.13 inches (3.3 mm) per year since 1993. The Economist magazine predicted that $100 billion of US real estate would be underwater by the century's end. Beyond direct impacts, climate change affects water availability (wet areas becoming wetter, dry areas drier), agricultural patterns, and potentially ocean currents such as the Gulf Stream. Heat of fusion principles mean that once ice melts, enormous energy is needed to refreeze it. While 97–99% of actively publishing climate scientists agree that climate change is human-caused, political inability to implement prevention strategies means most current approaches focus on adaptation.
Key Takeaways
- Three Essential Environmental Safety Tools: Environmental scientists use risk assessment (predicting health impacts), measurement protocols (sampling and laboratory analysis), and regulatory standards (EPA's MCLs for water, NAAQS for air) to determine safety from contamination. These tools work together to answer "how clean is clean enough?" with regulatory thresholds typically ranging from 1 in 1 million to 1 in 10,000 risk.
- US Environmental Quality Improving but Challenges Remain: General environmental safety has improved dramatically since the 1972 Clean Water Act—water-borne diseases eliminated, rivers becoming fishable again, and comprehensive pollution regulation in place. However, the "last frontier" is unregulated chemicals in household cleaning and personal care products that volatilize into indoor air and are absorbed through the skin, potentially posing a greater risk than regulated industrial contamination.
- Global Water Security Depends on Local Infrastructure and Energy: While Earth has sufficient water resources, distribution is uneven, and infrastructure is inadequate in many regions. China mines groundwater faster than it is replenished; Nigeria has abundant water but no delivery systems; and Saudi Arabia relies on energy-intensive desalination. Solutions exist (water reuse, conservation, desalination), but they require massive infrastructure investment and sufficient energy availability.
- Post-Carbon Energy Transition Requires Unprecedented Investment: Proven carbon reserves provide approximately 150 years of energy at current consumption, assuming no growth and ignoring climate change impacts. Transitioning to solar, wind, and nuclear power is technically feasible (solar radiation on land alone provides 1,200 times global energy needs) but would require capital investment potentially reaching 60 times US GDP, even with economies of scale, and would also involve solving practical challenges such as nuclear waste disposal.
- Climate Change Data Indisputable Though Solutions Remain Elusive: Atmospheric carbon dioxide reached 400 ppm in 2014 (25% above 1960 levels), Earth's temperature rose 1.1�C since the late 19th century, and sea level rose 0.13 inches annually. These facts are undeniable regardless of cause attribution. While 97–99% of actively publishing climate scientists agree that change is human-caused, political inability to implement prevention means current strategies focus on adaptation rather than prevention, with unknown consequences for future environmental conditions.
Ready to pursue a career using these environmental assessment tools? Explore environmental science degree programs that prepare you for careers in environmental consulting, risk assessment, water quality management, and climate science.

Summary
Are we safe from pollution? Generally, yes. The quality of the air we breathe and the water we drink continues to improve and is fairly well regulated. In most cases, there is little actual risk from hazardous waste sites. Perhaps the largest potential risks we face are: radon in our homes, household chemicals, radiation, and climate change.
Are we safe because the Earth will have enough water? The uneven distribution of water will cause problems, such as potential aggression by powerful countries like China and economic upheavals in regions of some countries, such as the southwestern US. Safe water distribution will limit development in much of the world. Water will become increasingly critical for agriculture to meet the needs of a growing population. But overall, improving water reuse and the potential for desalination if we can solve the energy equation, offer long-term hope for water safety.
Are we safe because the Earth will have enough energy? This is perhaps our most difficult issue. Fracking has given the US a reprieve, but don't be fooled. There are absolute limitations to our carbon energy future. Some combination of renewables and nuclear power is our most likely solution, but it will entail high costs and risks. Some kind of "technology fix" would be nice, perhaps from dark energy. The safety issue about energy, if we don't crack the code, may not be extinction, but it will be the end of life as we know it.
So drink safely and build a windmill.
Other Lectures by Dr. Neil S. Shifrin
- Environmental Perspectives
- Environmental Management and Its History
- Is It Safe? Raising Environmental Questions (Currently here)
Note: This article preserves Dr. Neil S. Shifrin's 2015 lecture content with updated fact-checking where indicated. Data reflects conditions as of 2015 unless otherwise noted.
- Environmental Perspectives - July 30, 2018
- Environmental Management and Its History - July 31, 2015
- Is It Safe? Environmental Questions About Pollution, Water & Energy - April 10, 2015
Related Articles


Featured Article

Environmental Finance: Careers, Tools & Applications