

This technical guide covers environmental measurement, data analysis, and regulation from a 45-year industry perspective. Topics include sampling methodology, analytical chemistry, data interpretation, major environmental laws (Clean Water Act, Clean Air Act, CERCLA/RCRA), and practical limitations in environmental management. Ideal for students, early-career professionals, and anyone seeking an insider's view of how environmental science translates to real-world practice.
Environmental science translates complex chemistry, data analysis, and regulatory frameworks into real-world impact. This technical guide draws from 45 years of industry experience to explain how we measure environmental conditions, interpret data, and apply regulations that protect public health and ecosystems. Whether you're a student evaluating this field, an environmental engineer navigating regulations, or simply curious about how environmental protection actually works, this comprehensive overview covers the fundamentals practitioners use every day.
This guide covers seven critical topics that underpin environmental practice: environmental facts and statistics, measurement methodologies, data analysis and interpretation, regulatory frameworks, system limitations, public acceptance challenges, and product safety concerns. Each section builds on real-world project experience, from multimillion-dollar river-sampling programs to hazardous-waste remediation at sites like Love Canal.
Table of Contents
Interesting Facts
Understanding the scale of environmental systems provides essential context for measurement and management decisions. These statistics illustrate the magnitude of water use, waste generation, and energy consumption in the United States, helping environmental professionals understand the systems they're tasked with protecting.
Water use and treatment in the US:
- 322 billion gallons of water used daily, representing 7% of all precipitation
- 23% drawn from groundwater sources
- 7% delivered to homes of 258 million people through 160,000 public water supplies
- 40% allocated to agricultural irrigation
- 133 billion gallons per day consumed by power plants (plus 60 billion gallons of saline water for cooling)
- 32 billion gallons per day treated at 16,000 sewage treatment plants
- 20% of sewage is treated "onsite" through septic systems rather than centralized facilities
Waste generation and management:
- Billion tons per year of waste: 7.6 industrial, 0.25 municipal, 0.025 hazardous (RCRA-regulated—total toxic waste varies by definition)
- For scale: one million tons equals the mass of the largest ship ever made; the Great Pyramid of Giza weighs approximately 6 million tons
- 1,900 active landfills manage municipal solid waste, with 21 specialized facilities for hazardous waste
- Food supply systems require approximately 1.2 acres per person to maintain current consumption patterns
- 100 nuclear reactors operating nationwide generate 2,000 tons per year of nuclear waste, requiring specialized long-term storage
Energy consumption breakdown:
- 100.4 Quads (quadrillion BTU) consumed annually (2022 data)
- 36% petroleum products
- 33% natural gas
- 11% coal
- 12% renewable sources (solar, wind, hydro, biomass)
- 8% nuclear power
These figures frame the environmental management challenge: protecting massive, interconnected systems while supporting modern society's water, waste, and energy demands. The infrastructure required—from treatment plants to distribution networks to monitoring systems—represents trillions of dollars in public and private investment.
How the Environment is Measured
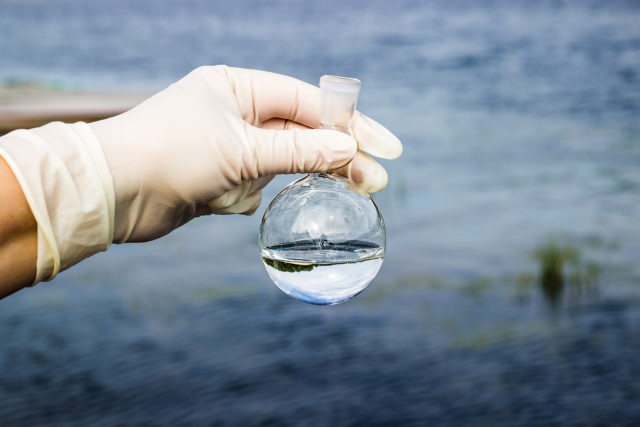
Effective environmental management requires accurate measurement, but measurement itself presents two distinct challenges: collecting representative samples and analyzing them to determine the presence and concentration of contaminants. Projects can easily exceed $100 million when comprehensive sampling programs are required for large waterways or complex industrial sites. Understanding measurement methodology helps explain why environmental data sometimes yields surprising or counterintuitive results.
Sampling Methodology
Representative sampling aims to understand large areas with as few samples as possible while maintaining statistical validity. Sometimes, initial sampling reveals poor spatial coverage, necessitating additional rounds to achieve appropriate representativeness. The objective is to balance information quality against project costs.
Environmental sampling addresses three-dimensional problems, significantly complicating representativeness. Soil sampling must consider depth—shallow soils affect human exposure, water table interfaces represent first encounters with aqueous media, and multiple aquifers trace various contaminant transport routes. Air sampling also varies by elevation—ground-level measurements affect people directly, while higher-elevation data track pollution transport patterns. Every data location, frequency, and measurement type requires an explicit rationale. Otherwise, organizations accumulate boxes of data without a clear application.
Common sampling objectives include:
- Determining contamination presence and severity (clean or dirty, and how dirty)
- Distinguishing off-site background from on-site impacts
- Quantifying pollution release rates, transport velocities, or migration distances
- Assessing exposure pathways for humans or ecological receptors
- Identifying time trends (improving or degrading conditions)
- Characterizing temporal variability and cyclical patterns
Background conditions represent the second most important sampling consideration—establishing what's "natural" or "normal" for a given location. Background can be either pristine (natural conditions) or anthropogenic (humanly affected). Urban soils generally reflect anthropogenic background contamination from vehicle emissions, industrial activities, and building materials.
Once objectives are clear and the background is understood, practitioners design representative sampling programs that specify the number and location of samples (in three dimensions), the frequency based on temporal considerations, and analytical parameters that dictate sample volume and collection methods. Truly representative samples require collection methods that don't alter the sample itself. EPA and state agencies publish hundreds of guidance documents on sampling methods, yet unique circumstances still require professional judgment and field adaptation.
Common sampling strategies include grid sampling (systematic spatial coverage), random sampling (statistical validity), and transect sampling (following suspected plume directions). Frequent mistakes involve oversampling obvious areas while undersampling less apparent zones, creating bias that undermines data interpretation. Experienced wildlife biologists and environmental consultants recognize these patterns when designing field programs.
Critical sampling design considerations:
- Data density: Sometimes one sample per acre suffices; other situations demand 20 samples in a backyard. Requirements depend on expected spatial variability and intended data use. See big data applications in environmental science.
- Timing and frequency: Cyclical releases require sampling that accounts for temporal patterns. Sampling at midnight to measure solar radiation yields meaningless results. Similarly, weekly sampling misses daily variation patterns when daily data drives regulatory concerns.
- Parameters: Measured qualities must align with contamination concerns. Sampling for iron when toxic organic chemicals are the issue produces unhelpful results.
- Detection limits: If regulatory concern starts at a concentration level 1, but analytical methods only detect down to level 10, the results cannot address the concern, regardless of sampling quality.
Analysis
Once representative samples are collected, analytical chemistry determines what's present and at what concentrations. Environmental analysis has evolved dramatically over the past century, from basic "wet chemistry" to sophisticated electronic instrument analysis.
Early environmental monitoring relied on wet chemistry to measure fundamental parameters: acidity (pH), turbidity, suspended solids, dissolved oxygen, trace metals such as chromium, and biochemical oxygen demand (BOD). Chemical contamination was typically assessed using crude tests for "phenols" and "oil and grease," resulting in relatively primitive pollution definitions compared with modern standards.
Modern instrumental methods—gas chromatography, mass spectrometry, atomic absorption spectrophotometry, and inductively coupled argon plasma spectroscopy—offer specificity and sensitivity that were unimaginable decades ago. Current methods can measure 1 part per quadrillion of 2,3,7,8-tetrachlorodibenzodioxin (TCDD) in water. One part per quadrillion approximates the thickness of a human hair compared to the distance to the moon. TCDD is one of the most toxic environmental contaminants. Today's technology even enables groundwater elevation measurement from satellites, demonstrating how measurement capabilities and environmental understanding have advanced dramatically.
Sample analysis involves two components: sample preparation and measurement. Sample preparation involves collecting field samples (soil in bottles, water in containers) and carefully preparing them for instrumental analysis without introducing alterations that could affect results. Many instruments require liquid inputs, so preparation typically extracts contaminants from solid samples into solvents suitable for injection. EPA and state agencies publish detailed guidance documents and regulations governing analytical methods for environmental samples.
Instruments perform two functions: identifying compounds of interest and measuring their quantities, which convert to concentrations through careful tracking of preparation steps. Key analytical approaches include:
Gas Chromatography: The workhorse for organic (carbon-based) chemical analysis. In injected sample preparation, compounds move through heated tubes, with different chemicals exiting at different times based on their specific chemical properties. This "spread" creates a chromatogram—originally named for color separation across absorbent paper. Benzene appears much earlier than TCDD, enabling predictable identification. Timing remains constant because known "standards" establish expected residence times for each compound.
Mass Spectroscopy: Mass spectrometers are attached to gas chromatographs to enhance chemical identification. They fragment molecules via controlled bombardment, producing predictable fragments that enable precise compound identification.
Detectors: After identifying compounds, detectors measure quantities by responding to chemical properties in proportion to concentration. Flame ionization detectors measure ions formed when gaseous chemicals burn. Electron capture detectors measure electrons released after radioactive particle bombardment.
Combined output produces gas chromatograms—graphs showing peaks, with peak timing (residence time) identifying chemical names and peak areas enabling quantity calculation by comparison with previously injected analytical standards. Most organic environmental contaminants are measured by gas chromatography.
Atomic Absorption Spectroscopy: Spectroscopy analyzes spectral lines emitted when atoms interact with light. Colors appearing (emission spectroscopy) or disappearing (absorption spectroscopy) enable measurement. Trace metals, when heated, remove specific, reproducible wavelengths from the light spectrum, enabling the identification and quantification of elements such as chromium, cadmium, and lead. Inductively coupled argon plasma spectroscopy uses similar principles but employs a different, often more efficient methodology. Astronomers use related spectroscopy principles to measure star ages.
Modern instruments are powerful and sensitive. In accordance with regulations and scientific knowledge, commercial laboratories maintain established chemical suites that they routinely analyze in environmental samples. The EPA established 129 "Priority Pollutants" under the Clean Water Act in 1976, creating a standard analytical method available from most laboratories. Labs often extend beyond standard lists to report the next 10 or 20 most prevalent compounds, called "Tentatively Identified Compounds," by comparing mass spectrometry data to computer libraries containing thousands of chemical mass spectra. Computer matches sometimes produce errors that require verification by experienced analytical chemists.
Data interpreters consider several quality factors, including detection limits, precision, and accuracy, as well as the overall sampling design and rationale. Detection limits are the lowest measurable levels, analogous to hearing sound, recognizing it as speech, and understanding its content. Detection limits vary by thousands depending on laboratory capabilities and specific chemicals. Reported concentrations near detection limits are often inaccurate; values 10 times or more above detection limits are more reliable.
Accuracy represents the ability to measure correctly—an accurate measurement yields the true value. Precision represents reproducibility—three precise measurements would cluster closely together. Laboratories demonstrate their detection limits, accuracy, and precision through quality control protocols, and thorough environmental data interpretation includes reviewing these quality control results.
Some environmental parameters actually represent groups of chemically similar compounds rather than single chemicals. Measuring these groups accurately is challenging, yet some are critical environmental contaminants. PCBs (polychlorinated biphenyls) exemplify this challenge. PCBs comprise 209 chemically similar compounds, but measuring all 209 individually often proves impractical or meaningless. PCB measurement remains challenging and always requires review by professionals who understand both their chemical nature and analytical methodology.
Environmental measurement combines representative field sampling with sophisticated laboratory analysis. Success requires clear objectives, appropriate methods, quality control, and expert interpretation—skills developed through education and experience in environmental chemistry and related fields.
What is Done with Data

Data analysis involves two components: organizing information and interpreting its meaning. Proper organization facilitates understanding. The organization requires appropriate storage and effective display. Understanding involves comparing measurements against regulatory standards and concentration thresholds believed to cause impacts (health effects, fish kills, ecosystem damage, aesthetic degradation), and applying environmental knowledge of chemical behavior based on properties such as solubility and volatility. This is where decisions happen—determining what data actually means.
Organizing Environmental Data
Environmental data consists of two parts: data (the actual measurements) and metadata (contextual information). "Data" includes quality measures—concentration, temperature, pressure, and hydraulic characteristics like conductivity. Metadata provides context—depth, date, sample type, and location coordinates. Units of measurement are critical for both data and metadata: mg/L for concentration, ft bgs (feet below ground surface) for depth. Without units, data becomes useless. Not everyone understands this fundamental principle.
Units sometimes reveal information about samples. Concentration units of mg/L indicate water samples, while mg/kg typically represents soil concentrations. Non-scientists and imprecise practitioners use "parts per million," which provides no information about sample type and can be interpreted incorrectly for air samples. Professional environmental work requires metric system units: mass per unit volume or mass per unit mass.
Typically, environmental data points include a dozen or so critical metadata fields: sample type, date, units, corresponding temperature, analytical method, laboratory, and quality-control flags.
Contemporary regulatory frameworks group contaminants by regulation and analytical method: volatile organic chemicals (VOC), semivolatile organic chemicals (SVOC), trace metals, PCBs, pesticides, and chlorinated organics. The Clean Water Act's 129 Priority Pollutants form one regulatory list. RCRA (Resource Conservation and Recovery Act) hazardous waste law includes several hundred "Appendix IX" groundwater monitoring compounds. Sometimes these groupings reflect analytical methods, sometimes similar properties, sometimes similar environmental characteristics—often a mixture. VOCs tend to be more water-soluble and can be ordered as a single "VOC lab analysis." Different methods target the same compound groups for different regulatory purposes: EPA Method 8021 covers VOCs under RCRA, while EPA Method 524 addresses "purgeable" organic compounds in drinking water.
Environmental data is typically organized by media (air, groundwater, surface water, soil), analytical fraction (VOCs, SVOCs, metals), and sampling round (temporal grouping). Soil data shows the least temporal sensitivity—2010 soil data likely still represents current conditions, whereas 2010 groundwater data may not.
RELATED: Environmental Data Analyst Careers
Visualizing and Interpreting Data
Graphical data presentation provides powerful interpretation tools. Contour plots assign different colors to concentration ranges, enabling visual pattern recognition. Three-dimensional representations combine color coding with height to emphasize concentration variations. The posted data plots show various types of information connected visually to locations, which is critical for understanding environmental conditions spatially.
Patterns and trends drive interpretation: source identification, transport pathways, contamination extent, and temporal trends indicating improvement or degradation. Data analysis needs to inform sampling program design. Environmental scientists with experience in data interpretation design the most effective sampling programs because they understand what information they need.
Once organized and displayed, data interpretation addresses two related considerations:
- How do measurements compare to regulatory standards or triggers?
- Is it safe?
The companion lecture "Is It Safe" addresses safety considerations in detail. Here, the focus is on comparing concentrations to pertinent regulatory standards or criteria:
- Drinking water measurements compared to Federal Maximum Contaminant Limits (MCLs)
- Air measurements compared to Federal National Ambient Air Quality Standards (NAAQS)
- Surface water measurements are compared to classification standards based on designated uses
Some media lack direct standards. Groundwater quality has no universal standards per se, but measurements often compare to drinking water standards for context. Most states now provide optional "lookup tables" for action-trigger concentrations in groundwater and soils at hazardous waste sites. These options have greatly facilitated cleanup decisions.
Environmental standards developed by federal and state agencies aim to protect health and the environment. However, practitioners also conduct risk assessments—human health and/or ecological—as supplementary analysis or to override lookup tables when site-specific conditions aren't properly covered. That's the "is it safe" component.
Risk Assessment Methodology
Risk assessment involves three components: predicting how chemicals reach the body, how they enter the body, and what happens inside the body. EPA and many states publish guidance documents standardizing risk assessment procedures:
- To the body: "Fate and transport" analysis predicts contaminant migration to estimate chemical concentrations or mass loadings at body intake points (inhaled air, ingested water). This analysis represents the culmination of what environmental scientists study and apply professionally.
- Into the body: "Exposure analysis" considers how chemicals enter the body through skin absorption, inhalation, and ingestion, and accounts for basic body functions like breathing rates. Reference books provide exposure factors, but appropriate "exposure scenarios" prove more critical. Exposure scenarios describe activities that result in chemical exposure: swimming in a lake once weekly for one hour and working in a factory eight hours daily for 30 years. Agencies sometimes insist on unrealistic exposure scenarios—one case required assessing PCB exposure risk to a one-year-old infant four feet deep in stream sediments, clearly not that child's primary health threat.
- Inside the body: Toxicology defines chemical health effects. For human health risk assessment, chemical toxicity data primarily come from the EPA's IRIS (Integrated Risk Information System), compiled and updated by EPA toxicologists. EPA requires the use of IRIS for federally related assessments.
Integrating these components estimates potential risks under examined exposure scenarios at predicted contaminant concentrations. Risk is expressed differently for carcinogens versus non-carcinogens. EPA requires action if the potential cancer risk exceeds 1 in 10,000 or the non-cancer risk exceeds the recognized "safe doses" from IRIS.
Important risk assessment considerations:
- Risk assessments typically overestimate risks for multiple reasons, building conservatism into estimates
- Consider whether assumed exposure scenarios actually apply to specific situations
Another common safety analysis compares measurements to the background. Sometimes measurements might be considered unsafe but are comparable to the background, leaving limited remediation options. Arsenic in Bangladesh groundwater exemplifies this challenge—WHO guidelines recommend 10 �g/L, but Bangladesh's standard remains 50 �g/L due to naturally elevated arsenic levels that affect millions of wells.
Environmental data management involves representative sampling to address specific objectives, organizing and presenting data for insight, considering spatial distributions and temporal trends, comparing measurements against standards and background, estimating potential exposure risks, and taking action when warranted. Professional practitioners understand how to measure environmental conditions and interpret results appropriately. Whether society actually measures what needs measuring and takes the right action when needed remains a separate question.
Environmental Regulation
In the United States, nearly every environmental aspect is regulated, including drinking water, surface water, air quality, hazardous waste, construction, nuclear power plants, and industrial facilities. "Regulated" generally means the government sets quality and operational standards, requires proof of compliance, and can enforce adherence when facilities fail to meet requirements. Understanding these three regulatory components—standards, monitoring, enforcement—provides framework for comprehending environmental law.
Congress passes laws; agencies implement laws by enacting regulations. The four major environmental laws are the 1972 Clean Water Act, the 1970 Clean Air Act, the 1974 Safe Drinking Water Act, and two hazardous waste laws: CERCLA and RCRA. Each law spawned thousands of specific regulations.
| Law | Year Enacted | Primary Purpose | Key Mechanism |
|---|---|---|---|
| Clean Water Act | 1972 | Control water pollution through wastewater discharge permits | NPDES permits, stream classification, waste load allocation |
| Clean Air Act | 1970 | Establish air quality standards and control emissions | NAAQS (6 criteria pollutants), State Implementation Plans |
| Safe Drinking Water Act | 1974 | Regulate public water supply quality | Maximum Contaminant Levels (90+ regulated contaminants), treatment requirements |
| CERCLA (Superfund) & RCRA | 1980 & 1976 | Clean up hazardous waste sites and regulate new waste | Remedial investigations, feasibility studies, and responsible party liability |
Clean Water Act
Congress addressed water pollution control as early as 1948, but two years after the first Earth Day passed the first comprehensive federal water pollution control law: the 1972 Clean Water Act. This law manages water pollution by controlling wastewater discharges. Every discharge pipe in the US requires a permit under Clean Water Act regulations. Agencies review each permit, considering the receiving water capacity to handle discharges while meeting designated water quality standards.
Every US surface water has been "classified" under water quality standards established based on feasibility and desired uses—from potable to fishable to waste conveyance (though few waters retain the lowest classification). The permit system operates under the acronym NPDES (National Pollution Discharge Elimination System). The waste load allocation process determines permit limits by considering all discharges and natural purification processes to arrive at allowable limits for each discharge. Stream classification (also applicable to lakes and saltwater) assigns predetermined water quality concentrations that scientists have determined meet designated use needs.
The 1970s witnessed huge nationwide efforts to build and upgrade wastewater treatment plants. Many wastewater discharges were completely untreated at the time. Congress established an eight-year schedule for upgrades and provided funding to municipalities through the "construction grants program." The industry faced the same deadline without grant assistance. Industrial wastewater treatment proved particularly challenging due to variability in waste streams. Municipal sewage, while fairly predictable in composition, faced challenges with leaky sewer infrastructure. By the 1990s, these issues were largely resolved, water quality improved dramatically nationwide, and EPA turned to the remaining major challenge: stormwater control.
Stormwater control presents exceptional challenges because it carries more contamination than is commonly recognized, and flows vary dramatically. Detention ponds along highway medians and hay bales around construction sites represent ongoing stormwater management solutions.
The Clean Water Act includes additional elements, such as acid rain programs and phosphorus controls, to prevent lake eutrophication. Generally, the Clean Water Act has succeeded—facilities treat wastewater, and surface water quality has improved dramatically nationwide. Room for improvement remains, and environmental science continues to advance solutions.
The Clean Water Act's stated goal is "zero discharge." Achievement remains unlikely and probably unnecessary.
The Clean Air Act
The Clean Air Act, passed in 1970, was the first modern comprehensive environmental law. It established National Ambient Air Quality Standards (NAAQS) and spurred hundreds of regulations for emissions, old and new. Air quality management differs from water quality management. Air quality is affected by mobile sources (cars) and stationary sources (smokestacks). Both face Clean Air Act regulations. Air quality is affected by point sources (e.g., smokestacks) and fugitive emissions (windblown materials, vented factory air). Measuring air quality proves more difficult than measuring water quality. On the positive side, atmospheric volume provides substantial dilution capacity. Regardless, areas with high emission densities, such as industrialized cities, still experience air pollution and are designated "non-attainment areas" because they fail to meet one or more NAAQS. EPA closely monitors non-attainment areas.
Only six NAAQS exist—ozone, carbon monoxide, particulates, lead, sulfur dioxide, and nitrogen dioxide—but they dominate air quality concerns ranging from smog to health effects from particulates and lead. Congress also passed amendments requiring the EPA address Hazardous Air Pollutants (HAPs) through emission controls rather than ambient standards.
Clean Air Act implementation involves unique federal-state partnerships. States develop statewide plans, called SIPs (State Implementation Plans), after reviewing and limiting emissions from all state sources. The EPA then approves the plans or requires greater stringency. Emission limits based on predicted ambient air quality from estimated emission rates, with downwind impacts estimated by air quality modeling. Wind variability among hundreds of factors makes prediction difficult. EPA provides standardized air models for emitters to make predictions. Model predictions typically achieve accuracy within a factor of about two.
The Clean Air Act includes many other elements, such as the phaseout of leaded gasoline. Generally, US air quality is quite good. Problem areas persist—Boston tends to be ozone nonattainment during the summer. Air control can be expensive—one lead smelter spent $80 million before still closing due to non-attainment. Globally, thousands die annually from air pollution, but perhaps not in the US, thanks to the Clean Air Act.
Safe Drinking Water Act
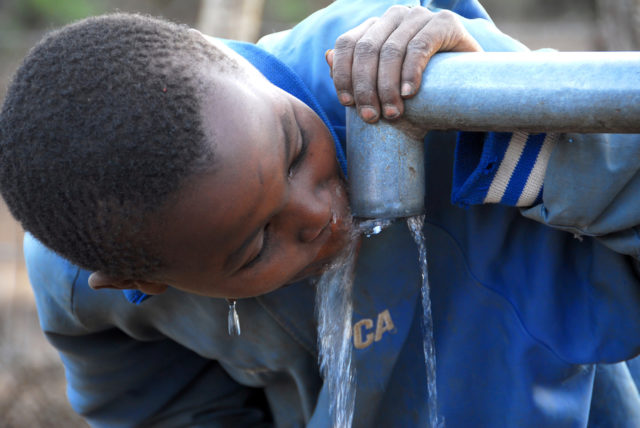
The Safe Drinking Water Act applies only to public water supplies—not private wells or bottled water. This excludes approximately 20% of the population.
The law regulates 160,000 public water supplies in the US. Eighty-four percent of those utilities supply fewer than 3,000 people. Many utilities use surface water sources, but 32% rely on groundwater. The Safe Drinking Water Act regulates output quality and requires maintaining chlorine levels in distribution pipes to prevent recontamination en route to homes. Drinking water chlorination effectively eliminated waterborne diseases such as typhoid in the US, though it creates trihalomethanes (toxic byproducts) and requires EPA monitoring.
The most important element of the Safe Drinking Water Act is establishing federal drinking water standards. Key components include:
- MCLs (Maximum Contaminant Limits): Federal drinking water standards applying to all public water supplies. More than 90 regulated contaminants exist, including specific chemicals, microbes, and properties such as radiation. Primary MCLs based on direct health effects are enforceable; Secondary MCLs based on aesthetics are not. EPA develops and updates MCLs based on scientific evidence and economic impacts. For carcinogens, EPA sets MCLGs (Maximum Contaminant Level Goals) at zero because no carcinogen consumption is preferable, but actual MCLs exceed zero because zero isn't economically practical. Higher values aim at minimizing risk at a reasonable economic cost. Cancer risks from these non-zero carcinogen levels are probably minimal and safe compared to other daily risks.
- Drinking water treatment plants: The EPA provides subsidies for these systems and requires operator training and certification. Most, but not all, public water supplies include treatment. Typical treatment trains include suspended solids removal and disinfection, with some systems needing chemical removal using activated carbon adsorption—essentially large-scale "Brita Filters." Public systems include distribution pipe networks and treatment plants.
- Monitoring and reporting: Public water supplies must test for MCLs at multiple system points, at frequencies determined by system characteristics. Testing follows EPA methods in EPA-certified labs. Public supplies report to states; states report violations to EPA. States and the EPA enforce MCL violations. Each community public water supply must prepare an annual "community confidence report" in July, including monitoring results, MCL violations, and health effects information. States prepare reports on all systems each July, often available online. EPA maintains a database on all public water supplies called "SDWIS – Safe Drinking Water Information System," accessible through the EPA website.
- Source protection: The law requires states to conduct Source Water Assessment Programs (SWAPs) for every public water supply source. SWAPs map protection areas, identify possible contaminant sources, and report to the public. Actual protection plans must come from local communities, often requiring multi-jurisdictional cooperation because watersheds don't respect political boundaries.
One notable development is "water reuse," which is receiving attention in dry areas such as California. Water reuse involves recycling wastewater for beneficial use—for example, irrigating lawns with washing machine water. The water reuse industry distinguishes greywater (everything except toilet water) from blackwater. Greywater reuse currently focuses on understanding quality, determining required treatment levels for target uses, and addressing plumbing changes for collection and delivery. While promising, subtle but significant issues exist, such as trace metals in water reused for irrigation. Wastewater sludge recycling for fertilizer faces similar challenges. Recycling is valuable, but materials are called "waste" for valid reasons.
US drinking water is generally quite safe. While bottled water quality has improved under FDA oversight, public water supplies face more stringent testing requirements and public reporting than bottled water. Public water users should review the July reports and judge for themselves. Private well users face different considerations, as outlined below.
Hazardous Waste Laws
The 1979 Love Canal crisis transformed environmental engineering overnight toward a focus on hazardous waste. Some argued that the Clean Water Act exacerbated hazardous waste problems by requiring burial of waste to protect surface water. The problem extended deeper. Industrialized 20th-century America generated massive hazardous waste—66 million tons yearly of industrial process waste in 1967—without regulation and with the recommended practice of ground burial as the safest disposal method. This approach returned to cause serious problems in the 1980s. Congress responded with two laws:
- RCRA (Resources Conservation and Recovery Act): Manages newly generated hazardous waste and cleans up old hazardous waste problems at operating facilities like landfills and factories.
- CERCLA (Comprehensive Environmental Response Compensation and Liability Act, aka Superfund): Cleans up "abandoned" hazardous waste.
From a community perspective near hazardous waste sites, these laws accomplish similar goals—protecting public health. Many regulatory requirements overlap, particularly the cleanup study and consideration procedures. RCRA includes additional elements regulating newly produced hazardous waste, including landfill design and operation standards and factory disposal requirements. Superfund focuses exclusively on cleaning up old waste.
Superfund history includes interesting developments. When passed in 1980, it first identified sites nationwide that qualified as Superfund sites by being placed on the National Priorities List (NPL). The Hazard Ranking System model scored sites; any ranked above 24.5 became a Superfund site. The 24.5 trigger was set, ensuring every Senator received a Superfund site in their district. Currently, about 1,800 federal Superfund sites exist, with thousands of additional state-managed sites, with programs varying by state.
The "L" in CERCLA represents liability. Congress granted the EPA substantial authority, requiring potentially responsible parties (PRPs) to pay for cleanups. When no responsible party exists, EPA pays. Originally, the EPA funded cleanups through a "Superfund" funded by tax money for oil and chemical contamination. Today, the fund is depleted, and Congress hasn't acted to replenish it.
Federal regulation called the NCP (National Contingency Plan), originally established for oil spills, was adapted for hazardous waste cleanups in 1990. The NCP provides a roadmap for CERCLA and RCRA studies and cleanups. The laws sometimes use different names for identical processes, but EPA's stated NCP philosophy ensures "CERCLA quality" consistent cleanups nationwide through these basic steps:
- Remedial Investigation (RI): Called RFI (RCRA Facility Investigation) under RCRA, this is the site study. It may involve multiple rounds of investigation because finding needles in haystacks often requires iterative approaches. Purpose: define contamination nature and extent. The term "nature and extent of contamination" developed near the onset of Love Canal and associated landfill negotiations in the 1980s.
- Removal Action: Sometimes called "Interim Action," this allows early cleanup of particularly hazardous materials before final site-wide decisions. Cleanup of leaking barrels in abandoned warehouses exemplifies this.
- Feasibility Study (FS): Examines remedial options. Usually examines a half-dozen combinations of remedy elements, including "no action." EPA published extensive guidance for performing "RI/FS" investigations.
- Record of Decision (ROD): Responsible parties often perform RI/FS, but EPA reviews and makes final decisions published in RODs.
- Remedial Action (RA): Once decisions are made, implementation proceeds through RAs. Sometimes, more specific field studies are required, called "Remedy Design Investigations." An RDI example might be additional sampling to precisely define excavation boundaries, as generally required in the ROD.
- No Further Action (NFA): The ultimate goal. When EPA issues NFA letters, work is complete, and sites are presumably clean. However, operations and maintenance requirements often extend for decades—groundwater extraction and treatment programs may take decades to remediate groundwater contamination.
Hazardous site remediation conceptually falls into two categories: those that manage contamination to prevent further contamination and minimize risks, and those that clean up hazardous waste. Site remedies often combine both approaches because complete cleanup often proves impossible.
| Remediation Approach | Description | Applications & Considerations |
|---|---|---|
| Excavation | Contaminated soils and chemicals are removed, eliminating sources and heavily impacted areas | Must address disposal: incineration, thermal desorption, chemical stabilization, landfarming (biodegradation), or offsite landfilling. Strict RCRA rules govern offsite disposal—will inadequate controls create future Superfund cycles? |
| In-Situ Stabilization | Soils and chemical areas injected with cement forming monolithic blocks that no longer leach chemicals | Becoming popular technology. Long-term effectiveness remains to be proven over decades. |
| Pump & Treat | Groundwater extraction with pumped water treated and discharged to streams or reinjected into ground | Originally addressed 90% of groundwater problems, now used only 30% of the time. Often technically and economically ineffective for complete restoration. |
| Natural Attenuation | Native microorganisms biodegrade organic chemicals. Sometimes enhanced with nutrients; sometimes just monitored (MNA - Monitored Natural Attenuation) | Now used at about 30% of sites, replacing Pump & Treat. Works well for biodegradable organics but requires long timeframes and careful monitoring. |
| Barriers | Management technique rather than treatment. Containment using caps, vertical walls (sheet piling, slurry walls), or hydraulic barriers from strategic pumping | Useful when treatment proves impossible. Requires long-term maintenance and monitoring. Often combined with other approaches. |
MNA and barrier management illustrate lessons learned over 35 years of hazardous waste management. For various technical reasons, fully cleaning up hazardous waste sites is usually impossible. Sites can be made safe, however. Risk modeling can help ensure final plans minimize risk, and, when all else fails, deed restrictions prevent more risky future uses.
Professional experience at Love Canal during Superfund's early years revealed that no one in government or science initially knew the right approaches to this problem. Much money and time were wasted. Today, accumulated knowledge enables effective hazardous waste site management, though not necessarily cost-effective management. The public should generally rest assured about the first point, but remain concerned about the second—wasted money. Limited environmental budgets demand wise spending. Wasted money ultimately comes from the taxpayer's pockets.
Other Environmental Regulations
Many other environmental and health issues face US regulation:
- OSHA (Occupational Safety and Health Act): Regulates workplace safety, both chemical and physical hazards.
- Nuclear safety: Managed by the Nuclear Regulatory Commission, established by the Energy Reorganization Act (1974), following the Atomic Energy Act of 1954.
- TSCA (Toxic Substances Control Act): Aims to test and manage new chemicals in the marketplace, though implementation effectiveness remains limited.
- FIFRA (Federal Insecticide Fungicide and Rodenticide Act): Regulates pesticide commerce and use.
- Food and Drug Administration: Regulates food safety.
- Consumer Product Safety Council: Oversees some product safety.
One estimate suggests there are hundreds of thousands of environmental regulations in the US—too many to count comprehensively. This creates compliance challenges.
Two important unregulated issues that may pose health risks warrant attention: Radon and Chemical Product Safety. Radon causes lung cancer. EPA advises (not enforces) that 4 picocuries per liter of indoor air represents the safe threshold. Over half the country exceeds this level in subsurface soil gas. Soil gas infiltrates homes through basement slab cracks, often resulting in radon levels exceeding the "safe" advisory. The question is whether the advisory level is truly safe. Health risk from that level likely exceeds 1 in 10,000 cancer risk—the trigger for cleaning up hazardous waste sites. EPA advises safety at a risk level, it would spend billions cleaning up in rivers. Test indoor air and water (radon vapor during showering poses risks). If air exceeds 4 pCi/L, install mitigation—pipes through basement floors running vacuums to extract gas and pump to roofs. This typically costs under $5,000 and reduces radon to about 1 pCi/L, about the best achievable. Still not completely safe, but better.
The second unregulated issue is chemical exposures from everyday products. This likely represents the largest environmental exposure risk today and is addressed in the final section.
Environmental regulation in the US is comprehensive but complex. Professionals in environmental policy and compliance help navigate these frameworks while protecting public health and ecosystems.
Limitations
While current environmental management represents the best achievable approaches, understanding limitations remains important. The biggest limitation, by far, is climate change, which is beyond this discussion's scope. Hopefully, knowledge will continue to advance, and society will find ways to fund improvements while awaiting global challenges. Important limitations within this discussion's scope include:
- Clean water: Stormwater and, in some cases, toxic chemicals remain problematic. In many US cities, stormwater runs through "combined sewers"—networks of both sanitary and storm sewers designed with overflows to surface waters when networks become overwhelmed with flow surges during storms. Those overflows contain street contaminants, sanitary sewage, and sediment from the sewer system. Work continues to separate sewers (storm from sanitary) and to treat stormwater, but completion remains distant. This explains why rivers and lakes are not yet fully clean.
Toxic chemicals represent another water quality limitation in some cases. Bioaccumulation is chemical storage in animal tissue, sometimes at ratios of a million to one. Very low water concentrations can bioaccumulate to high levels in fish tissue, posing a potential health risk if consumed. Biomagnification is increased tissue concentration moving up food chains—big fish eat small fish and accumulate higher concentrations. More risk if humans eat big fish. This isn't universal, but it can be important in some waterways. This represents third-order water quality issues. First order: make rivers not stink. Second order: avoid fish kills and enable swimming. Third order: make safe from toxic chemicals.
- Safe Drinking Water: Although public water must meet MCLs, which are believed safe, ongoing research on trace contaminant health effects requires staying ahead of toxic chemical issues. New concerns include parasites such as Cryptosporidium, which chlorination may not kill. EPA and others work diligently on these issues, but that doesn't eliminate current concerns. Not a major issue, but worth monitoring.
- Hazardous Waste: Understanding that complete hazardous waste site cleanup often proves impossible—and often unnecessary—is important. The first question is: what residual level is safe? Risk assessment addresses this fairly well. EPA's regulatory preference is to remove and destroy hazardous waste whenever feasible, but that's not always possible. One reason is that most hazardous waste sites contain NAPL (Non-Aqueous Phase Liquids). NAPLs may include petroleum waste, tar bottoms, spent solvents, or any material that does not mix well with water. Like oil and water in salad dressing, creating two liquid phases, most hazardous waste sites contain two phases. The problem is that removing all NAPLs is nearly impossible, and NAPLs are highly concentrated sources of chemical contamination in groundwater and soil.
EPA has rules for this hopeless situation called "Technical Impracticability" (TI). The problem is improper implementation. Their basic approach demands trying first, then applying for "TI waivers" when demonstrating futility. TI waivers must demonstrate: 1) continued attempts are hopeless; and 2) management approaches will contain residuals and guarantee safety. The problem is that 35 years of Superfund experience demonstrates that NAPL leaves at least residual problems, and insisting on trying first wastes money. Much money and time could be saved by pursuing better management approaches instead of removal attempts. Get TI waivers upfront.
Common sense and thinking outside the box must be applied to environmental management daily.
NIMBY

"NIMBY" stands for "not in my backyard" and kills progress. That said, who wants landfills next door? That's the conundrum. Permitting nuclear power plants takes more than 20 years; today, people have effectively abandoned such efforts. Even windmills near Martha's Vineyard took more than 10 years for approval. By reasonable estimates, about 60 years of carbon fuel remain, and renewables might offer 20 or 30% of future energy needs, so how will nuclear power plants get built? The solution involves appropriate compensation.
Not bribery exactly, but appropriate offsetting compensation. There are legitimate reasons to avoid environmentally questionable projects nearby: health risks and diminished property values. Projects must make local risks worthwhile. If placing a landfill in a town, provide a new park or similar benefit. The park should be intrinsic to the landfill project. The key is determining appropriate offsetting compensation—what will truly offset, for example, property diminution from the landfill? Prove that home value hits will be neutralized by offsetting project attractiveness.
Health risk potential must also be addressed through improved approaches. Two components exist: making risk assessments understandable and providing appropriate risk-benefit analyses. When Yucca Mountain nuclear waste repository promoters sought to justify it to Nevada, they argued for the national need. Nevadans don't particularly care about that. The project needed justification based on benefits to Nevadans. Offsetting compensation meaningful to Nevadans needed to be offered as part of the project. Yucca Mountain died because nothing was in it for Nevada. GE is sending PCB-laden Hudson River sediments it's dredging to a Texas landfill. The mayor is thrilled because the new landfill has become a needed revenue source and employment vehicle.
Proposed project risks must be made understandable to neighbors. One waste incinerator siting project in California held numerous public meetings filled with risk assessment experts discussing Gaussian plume models. Over neighbors' heads, dead on arrival. Not because those people were unintelligent, but because the science is jargon-filled, requires a deep scientific background, and scientists often never learned to explain things properly. Scientific education in the US sometimes carries a nuance that if you can't be understood, you must be smart.
The bottom line: prove and explain acceptable risks, and offer direct local benefits that offset those risks.
Product Safety
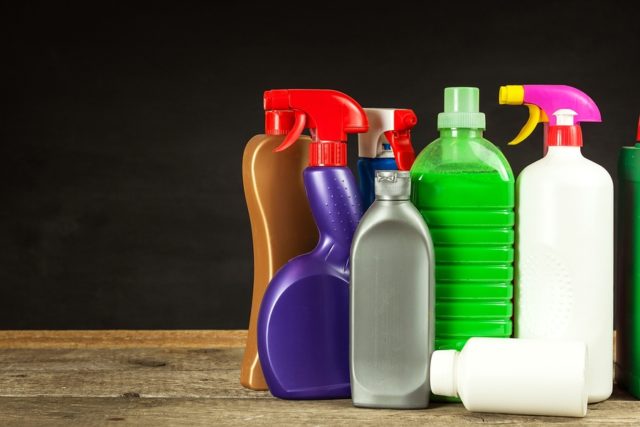
This concludes with a critical concern: product chemical safety. Currently, there is no effective regulation governing chemicals in products, and very little information is available. Visit the supermarket cleaning-fluid aisles and examine the labels. Typically, labels state "99% inert ingredients." That 99% is inert for claimed product performance, but not necessarily inert to health. One of the products investigated was a 50% carcinogenic solvent. How many cleaning and personal care products exist in homes? They're vaporizing under sinks right now and were likely rubbed on skin this morning. Are they safe? Unknown.
After operating a risk assessment consulting firm for 25 years, the professional opinion is that the potential risks from chemicals in the products we use far exceed those from most landfills, factories, or dirty rivers. EPA doesn't want to regulate inside homes (hence its radon approach), and the public doesn't want EPA to do so. How should this product-chemical issue be managed?
The first obvious step is proper product labeling. Second is measuring indoor air quality and exposures, such as in showers, and rigorously assessing risks to capture variability. Third is rating products according to chemical safety potential. No one does this; the Consumer Product Safety Council does not. If such a rating existed, buying decisions could incorporate both product efficacy and potential safety. With two counter-cleaning products performing equally well, which would you choose—the safe one or the less safe one? The safe one if you knew which was which, of course. But you don't know.
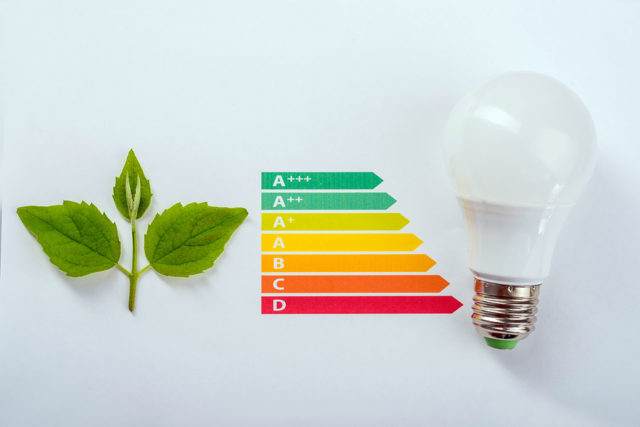
A key to a Product Safety Rating system is simplicity. Just as the Energy Star system lets you choose four-star refrigerators over three-star when both have the required shelves, we need the same simplicity for product safety decisions. That's no easy challenge because risk assessment issues are complex. But energy efficiency issues are also complex, and do you know what's behind the Energy Star system? Do you know who performs ratings? Somehow, we trust it to be true.
One major challenge in evaluating product safety is developing appropriate exposure scenarios. Exposure scenarios were discussed earlier under hazardous waste site risk assessment. Same approach here. The secret lies in smartphones.
Here's the envisioned system:
- You identify the desired product and check its star rating.
- You forgot what stars mean, but assume four is better than three.
- Alternatively, you want to understand star meanings, so you scan the barcode with your phone, receiving an explanation.
- Next, you determine whether the rating is based on exposure scenarios that apply to you. Perhaps you shampoo your hair only once a week, but the exposure scenario is assumed to be daily. You might ignore the three stars because your exposure is lower, assuming your use is at the four-star level. The challenge is making exposure scenarios easy to understand for supermarket aisle decision-making.
- Finally, you balance product performance and safety when making purchase decisions. All of this must take no more than five seconds; otherwise, it won't be used.
Assuming someone develops a simple, effective rating system, the most obvious benefit is that consumers would have information to make safety-based purchase decisions. But other benefits exist. Such a system would make all products safer, just as the Energy Star program made all appliances more energy-efficient. Additionally, manufacturers may use it as a marketing tool to reinvent and promote safer products. Everyone wins. Hopefully, someone takes the baton to make this happen someday.
Environmental science and regulation have come a long way, but improvements are still needed, and new frontiers remain to be opened. Hopefully, this has reassured you that, in general, you are safe in our environment and helped you understand how practitioners view it. Better understanding enables better decisions.
Frequently Asked Questions
What background do I need to understand this technical guide?
A basic understanding of chemistry and environmental science concepts helps, though the guide aims to make technical topics accessible. Students in environmental programs, early-career professionals, and career changers exploring the field will find this most valuable. The content draws from 45 years of industry experience to bridge academic theory and real-world practice.
How long does it take to become an environmental scientist?
Most environmental scientists hold at least a bachelor's degree (four years), though many regulatory and consulting positions prefer master's degrees (an additional one to two years). Hands-on experience through internships significantly improves career prospects. Specialized roles such as analytical chemists or toxicologists may require additional certification or a doctoral degree.
What's the difference between environmental science and environmental engineering?
Environmental scientists focus on monitoring, data analysis, and ecological assessment, while environmental engineers design systems and solutions like treatment plants and remediation systems. Both careers involve sampling, analysis, and regulatory compliance. Engineers typically need ABET-accredited engineering degrees and may pursue Professional Engineer (PE) licensure.
Are environmental regulations really effective?
Yes—surface water quality has improved dramatically since the 1972 Clean Water Act, air quality in most US cities meets standards, and hazardous waste management prevents the creation of new "Love Canals." Limitations exist (e.g., stormwater control and the impossibility of a complete site cleanup), but the regulatory framework generally protects public health and environmental quality. The US regulatory system serves as a model for many other countries.
What environmental career opportunities exist beyond consulting?
Regulatory agencies (EPA, state departments), municipal utilities, corporate environmental departments, analytical laboratories, and research institutions all employ environmental professionals. Each sector offers different balances of fieldwork, laboratory analysis, and policy work. Public-sector positions typically offer stability and benefits, while private-sector consulting offers project variety and potentially higher salaries.
Key Takeaways
- Representative Sampling is Critical: Environmental measurement requires clear objectives and understanding of spatial and temporal variability. Poor sampling design leads to unusable data regardless of analytical quality. Every sample location, frequency, and parameter must have an explicit rationale.
- Analytical Chemistry Has Advanced Dramatically: Modern instruments can detect contaminants at parts-per-quadrillion levels, enabling precise risk assessment and regulatory compliance tracking that were unavailable even 30 years ago. This sensitivity allows identification of problems at concentrations once unmeasurable.
- Four Major Laws Govern Environmental Protection: The Clean Water Act (1972), Clean Air Act (1970), Safe Drinking Water Act (1974), and hazardous waste laws (CERCLA/RCRA) form the regulatory framework, each with thousands of specific regulations. Understanding these laws is essential for environmental careers.
- Complete Cleanup Often Proves Impossible: Technical impracticability (e.g., NAPL contamination, bioaccumulation) means many sites require long-term management rather than full remediation, making risk assessment critical. Managed natural attenuation and containment barriers are often more cost-effective than removal efforts.
- Product Safety Remains Largely Unregulated: Consumer products pose potentially greater chemical-exposure risks than regulated industrial sites, yet lack comprehensive safety-rating systems or disclosure requirements. A simple product safety rating system similar to Energy Star could transform consumer protection and drive safer product innovation.
Ready to turn technical knowledge into environmental impact? Explore degree programs in environmental science and engineering that prepare you for careers in sampling, analysis, regulation, and remediation.
Other Lectures by Dr. Neil S. Shifrin
- Environmental Perspectives (Currently here)
- Environmental Management and Its History
- Is It Safe? Raising Environmental Questions
- Environmental Perspectives - July 30, 2018
- Environmental Management and Its History - July 31, 2015
- Is It Safe? Environmental Questions About Pollution, Water & Energy - April 10, 2015
Related Articles


Featured Article

How GIS is Revolutionizing Agricultural Science