
Drought is a temporary period when water availability falls below normal levels for a region, affecting humans, agriculture, and ecosystems. The United States experiences four types of drought—meteorological, agricultural, hydrological, and socioeconomic—each triggered by different conditions and impacting different sectors. While cyclical in nature, droughts have grown more intense due to climate change and increasing water demand.
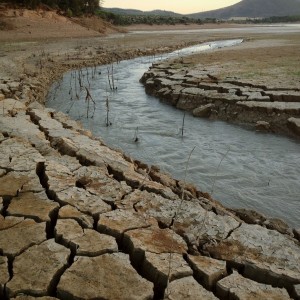
Water scarcity shapes ecosystems, economies, and communities across the United States. From the infamous Dust Bowl of the 1930s to the widespread droughts of recent years, these dry periods have tested our resilience and resourcefulness. Understanding drought helps us prepare, adapt, and protect the resources we depend on.
Drought affects every region of the country differently. What constitutes a water crisis in the Pacific Northwest differs from the challenges facing the Southwest. This guide explores the types of drought, their historical impact, current conditions, and practical steps individuals and communities can take to reduce their vulnerability.


Table of Contents
- What Is Drought?
- Historic Droughts in the United States
- Who Is Affected by Drought?
- Are There Regions More Sensitive to Drought?
- What Is Being Done to Prepare for Droughts?
- What Can You Do to Help?
- Frequently Asked Questions
- Key Takeaways
What Is Drought?
Drought is an extended shortage of water that disrupts normal conditions in a specific area. Unlike permanent aridity, drought is temporary and cyclical. The challenge of defining drought stems from its variability across locations and sectors.
Scientists and water managers recognize four distinct types of drought. Each type affects different aspects of our water systems and requires different monitoring approaches.
| Drought Type | Definition | Primary Trigger | Impact Example |
|---|---|---|---|
| Meteorological | An extended period of below-average precipitation | Significant deviation from average precipitation over weeks or months | Reduced snowpack, lower reservoir inflows |
| Agricultural | Insufficient moisture for crop production and livestock | Soil moisture deficit during the growing season | Crop failure, reduced hay production, livestock stress |
| Hydrological | Water reserves fall below established storage levels | Aquifers, lakes, or reservoirs drop below the threshold | Water supply restrictions, hydropower reduction |
| Socioeconomic | Human demand exceeds the available water supply | Population growth outpaces water infrastructure | Drinking water shortages despite normal precipitation |
Meteorological drought occurs first and, over time, triggers the other types. Agricultural drought typically continues even after rainfall returns, as soils and vegetation recover slowly. Hydrological drought can persist for years, affecting groundwater reserves long after surface conditions improve.
Socioeconomic drought highlights a critical reality: drought can occur even with normal precipitation if demand exceeds supply. This type is particularly concerning in high-growth regions and areas dependent on long-distance water transport.
Historic Droughts in the United States
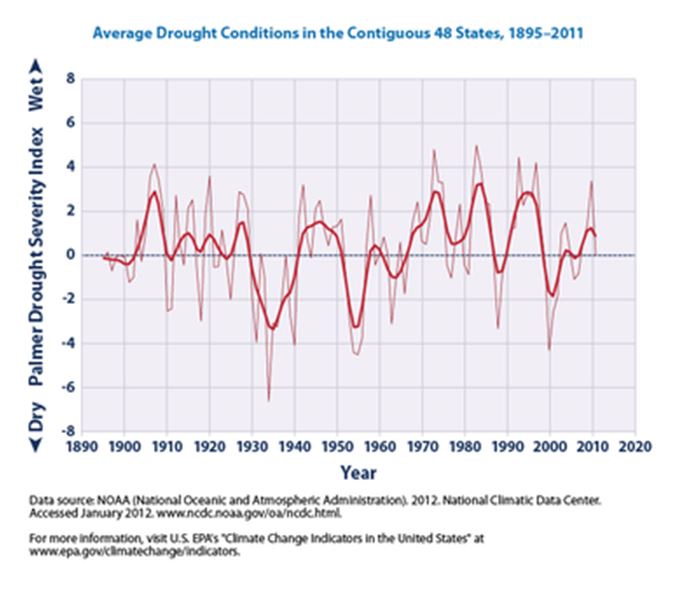
Weather records spanning over 100 years document severe droughts across the United States. Geological evidence and tree ring analysis extend this record back centuries. These patterns reveal cyclical trends, though recent decades have seen a concerning intensification.
| Period | Primary Region | Severity | Key Impacts |
|---|---|---|---|
| 1933-1940 | Great Plains, Central US | Over 70% of the US is affected, 50+ million acres impacted | Dust Bowl, mass migration, and agricultural revolution |
| 1950-1956 | Texas, Great Plains | 244 of 254 Texas counties declared a federal emergency | 50% crop yield reduction, livestock feed shortages |
| 1987-1989 | California, Western US | 36% of the US is affected | $39 billion in economic losses (adjusted for inflation) |
| 2012-2016 | Central US, California | 60%+ of the US is in severe drought, 1,000+ counties affected | 80% of agricultural land impacted, major livestock losses |
| 2020-2024 | Western US, Southwest | Megadrought conditions, Lake Mead reached historic lows in 2022-2023 | Water restrictions, interstate allocation disputes |
The Dust Bowl (1930-1940)
The Dust Bowl lasted from 1930 to roughly 1936, with lingering effects until 1940. This crisis revolutionized agricultural practices and land management across the nation. The combination of prolonged drought and poor cultivation techniques created devastating consequences.
At its peak, the drought covered over 70% of the United States and ravaged more than 50 million acres of land. The loss of vegetation and crops exposed the topsoil to wind erosion. Massive dust storms, called "black rollers," carried soil particles as far as the Atlantic Ocean.
This disaster taught critical lessons about soil conservation, crop rotation, and sustainable land use. The agricultural techniques developed in response to the Dust Bowl continue to protect farmland today.
The Five-Year Texas Drought (1950-1956)
The 1950s drought affected the Great Plains and, at times, nearly the entire United States. Low precipitation, combined with record-high temperatures, created severe agricultural stress. Crop yields dropped to 50% of normal levels, and hay became scarce and unaffordable for livestock feed.
By the drought's final year, 244 of Texas's 254 counties had received federal emergency declarations. The economic impact reshaped water management strategies across the Southwest.
The 1987-1989 California Drought
Though covering only 36% of the United States, the late 1980s drought resulted in an estimated $39 billion in economic losses (adjusted for inflation using USDA 1988 data). California bore the brunt of the impact. This drought highlighted the vulnerability of water-dependent economies and the high cost of inadequate drought preparation.
The 2012-2016 Nationwide Drought
More than 60% of the United States experienced severe drought conditions during 2012, affecting over 1,000 counties. According to the United States Department of Agriculture, over 80% of productive agricultural land was affected by drought. Livestock producers saw half of their total herd value affected by severe conditions.
This drought highlighted the interconnectedness of water systems and the cascading effects of prolonged dry conditions across economic sectors.
The Western Megadrought (2020-2024)
The Southwest and Western United States continue to experience what scientists call a megadrought—the driest 20-year period in over 1,200 years, according to a 2022 Nature Climate Change study led by Williams et al. Lake Mead and Lake Powell, critical reservoirs for the Colorado River system, reached historic lows in 2022 and 2023. Multiple states implemented unprecedented water use restrictions.
This ongoing crisis has forced difficult conversations about water allocation, urban growth limits, and long-term sustainability in arid regions. Climate change models suggest these conditions may represent the new normal rather than a temporary aberration.
Who Is Affected by Drought?
Drought impacts virtually everyone within affected regions and can spread economic effects nationwide or globally. Extended or severe droughts create conflicts over water rights and dramatically affect land values. Quality of life suffers from the loss of livelihoods, health consequences of degraded water and air quality, and ecosystem changes.
Water and Air Quality Impacts
Water quality declines as contaminants can become more concentrated due to reduced dilution, especially in stagnant or shrinking water bodies. Lower water volumes reduce the natural dilution of pollutants, affecting the quality of both surface water and groundwater. Air quality suffers from increased particulate matter generated by greater soil erosion.
Communities dependent on surface water sources face dual challenges of reduced quantity and degraded quality. Treatment costs rise as water becomes harder to purify.
Economic Consequences
Agriculture bears the most direct economic impact. Drought increases production costs for crops and livestock while reducing yields. These costs are passed on to consumers through higher food prices. Raw material costs rise across industries, from lumber production to manufacturing.
Energy costs can increase significantly, particularly in coastal regions. Hydropower provides 10-15% of California's electricity in wet years; this drops sharply during droughts. Drought forces utilities to purchase more expensive power from alternative sources.
Ecosystem Effects
Drought alters migration patterns, reduces water quality, and accelerates soil erosion. Ecosystem effects ripple through food chains and habitat networks. Threatened and endangered species face disproportionate impacts due to their sensitivity to habitat changes and food scarcity.
Severe drought conditions increase the likelihood and intensity of wildfires. Arid desert ecosystems adapted to low rainfall face different challenges than regions experiencing unusual dry periods. The food chain can become contaminated depending on water quality and the duration of drought.
Are There Regions More Sensitive to Drought?
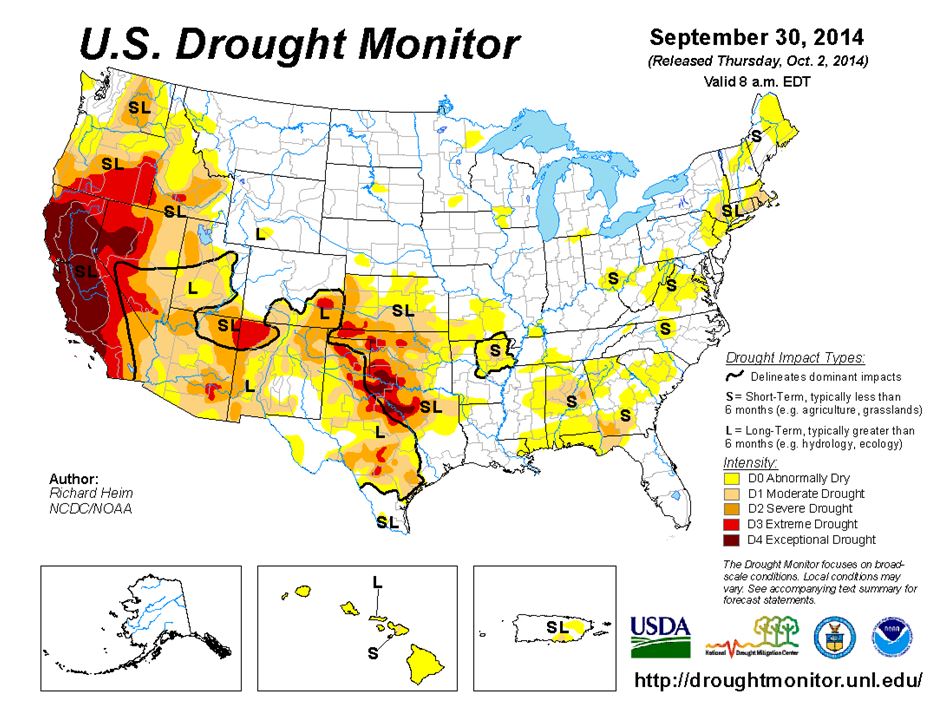
The western half of the United States experiences more frequent and severe droughts. Arid and semi-arid regions prove particularly sensitive to variations in precipitation and water usage. However, no area of the country is immune to drought.
Weather patterns such as El Niño and La Niña significantly influence drought cycles across regions. Climate change interacts with ENSO patterns, potentially amplifying their effects, though the relationship is complex and still under study. Even historically water-rich regions now face drought vulnerability as demand grows and precipitation patterns shift.
What Is Being Done to Prepare for Droughts?
Municipalities and water control boards develop comprehensive drought preparation and mitigation plans, particularly in drought-prone areas. Adequate planning includes four critical components: prediction, monitoring, assessment, and mitigation.
Prediction Systems
Prediction relies on models built from historical data. The National Integrated Drought Information System (NIDIS), created by Congress in 2006 and managed by NOAA, consolidated information from multiple agencies into one accessible source. Previously, data came from disparate sources, including Climate Studies, the National Climatic Data Center, the USDA, NOAA, and the National Drought Monitor.
Geographic Information Systems play an increasingly important role in drought prediction and resource mapping. These technologies help water resource engineers model future scenarios and plan infrastructure accordingly.
Monitoring Approaches
Monitoring combines established indicators and triggers, typically classified as mild, moderate, severe, and extreme. These indicators blend empirical data with field observations. Data sources include rain gauges, climate pattern analysis, reservoir level monitoring, crop performance data, land use information, and satellite imagery.
Real-time monitoring allows water managers to implement restrictions before conditions become critical. Early detection provides time for public education and voluntary conservation efforts.
Assessment Methods
Assessment compares actual data against prediction models to evaluate accuracy. Results inform future prediction modeling and improve drought response strategies. Water agencies compare real-world data to established indicators and triggers from monitoring systems.
The level of drought severity dictates which mitigation measures get proposed. Continuous assessment ensures responses match current conditions rather than outdated projections.
Mitigation Measures
Mitigation measures scale to drought severity and aim to minimize adverse effects as long as possible. Common strategies include increased public awareness campaigns, tiered water restrictions, development of alternative water sources, implementation of advanced agricultural techniques, and reduction of overall demand.
Demand reduction often works through incentive programs. Nevada's "cash for grass" program compensated residents who replaced water-intensive lawns with drought-tolerant xeriscaping. Similar programs in California and Arizona have reduced residential water use by 20-30% in participating communities.
What Can You Do to Help?
Individual and household actions collectively have a significant impact on water conservation. Start by engaging with your local municipal planning process to understand conditions in your area. Many communities offer free water audits that identify conservation opportunities specific to your property.
Daily water-saving actions include taking shorter showers, watering the lawn less often, and fixing leaks promptly. Modern appliances use significantly less water than older models—upgrading washing machines, dishwashers, and toilets can reduce household water consumption by 30% or more.
Landscape choices matter tremendously in drought-prone regions. Native plants adapted to local rainfall patterns require minimal irrigation once established. Rain gardens and permeable surfaces help capture and store precipitation rather than directing it to storm drains.
Support policy changes that promote sustainable water management. Participate in public comment periods for water allocation decisions. Vote for candidates who prioritize long-term water security over short-term development pressures.
Frequently Asked Questions
What is the difference between meteorological and agricultural drought?
Meteorological drought occurs when precipitation falls below normal levels for an extended period, typically triggered by significant deviations from average precipitation over weeks or months. Agricultural drought focuses specifically on soil moisture and its impact on crops and livestock, which can persist even after meteorological drought ends because soils and vegetation recover slowly. You can experience normal rainfall but still have an agricultural drought if the previous dry period depleted soil moisture reserves.
Which US states are most prone to drought?
Western states, including California, Nevada, Arizona, New Mexico, Utah, and Colorado, experience the most frequent and severe droughts due to their arid and semi-arid climates. The Great Plains states from Texas through Montana face recurring drought cycles. However, no state is immune—recent years have seen significant drought conditions in the Southeast, Pacific Northwest, and even parts of the traditionally water-rich Northeast as climate patterns shift.
How long do droughts typically last in the United States?
Drought duration varies widely depending on type and region. Meteorological droughts may last a few months to several years. The Dust Bowl lasted from 1930 to roughly 1936, with lingering effects until 1940, while the 1950s Texas drought persisted for five years. The current Western megadrought has persisted for over 20 years, making it the driest period in over a millennium. Agricultural and hydrological droughts often extend beyond meteorological drought as ecosystems and water systems recover slowly.
What causes drought to occur?
Drought results from a combination of below-average precipitation and, often, above-average temperatures that increase evaporation rates. Weather patterns like El Niño and La Niña significantly influence precipitation distribution across the United States. High-pressure systems that block storm tracks can persist for months or years, preventing normal rainfall. Climate change intensifies these natural patterns by increasing temperatures, altering jet stream behavior, and creating greater variability in extreme weather.
How does climate change affect drought patterns?
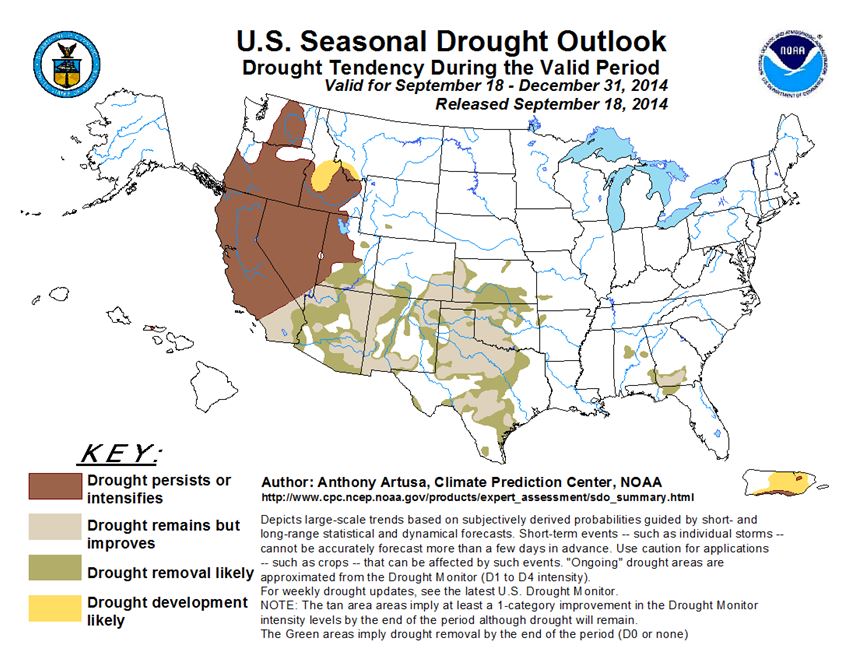
Climate change intensifies the water cycle, making wet periods wetter and dry periods drier. Rising temperatures increase evaporation rates, causing soils to dry faster even with normal precipitation. Climate models predict more frequent and severe droughts across much of the western United States, while some regions may experience increased flooding. The Southwest faces particular risk, with projections showing that conditions similar to the current megadrought could become permanent rather than cyclical.
What can individuals do during a drought?
Reduce indoor water use by taking shorter showers, fixing leaks, running full loads of laundry and dishes, and upgrading to water-efficient appliances. Outdoors, water lawns only when necessary (early morning or evening to reduce evaporation), use mulch around plants to retain soil moisture, and consider replacing grass with native, drought-tolerant landscaping. Participate in local water conservation programs and support municipal drought management plans. Even small actions add up when practiced community-wide.
How does the US government monitor drought conditions?
The National Integrated Drought Information System (NIDIS) coordinates drought monitoring across multiple federal agencies, including NOAA, USDA, and the National Drought Mitigation Center. The US Drought Monitor provides weekly updates showing drought severity across the country using data from climate stations, satellites, soil moisture sensors, and reservoir levels. This information, combined with local reports from agricultural experts, water managers, and weather observers, creates comprehensive, real-time drought assessments available to the public.
Key Takeaways
- Four Drought Types: Meteorological, agricultural, hydrological, and socioeconomic droughts each affect different aspects of water availability. Understanding these distinctions helps communities prepare appropriate responses.
- Cyclical Yet Intensifying: US droughts follow historical 20-30 year cycles, but climate change is amplifying their severity and duration. The current Western megadrought represents the driest conditions in over 1,200 years.
- Western Vulnerability: The western United States experiences more frequent and severe droughts due toan arid climate, though no region is immune. Recent decades have seen drought expand into traditionally water-secure areas.
- Individual Impact: Water conservation, drought-tolerant landscaping, and support for municipal drought plans help mitigate the impact. Household actions collectively reduce demand and extend available water supplies during dry periods.
- Comprehensive Monitoring: The National Integrated Drought Information System provides real-time drought data across all US regions. Modern prediction and monitoring systems enable earlier interventions and better resource management than past generations enjoyed.
Want to learn more about environmental challenges and solutions? Explore comprehensive resources on climate science, water resources, andecologicall careers shaping our planet's future.
- Cultural Resources in the Federal Environmental Process - March 8, 2015
- Environmental Finance: Careers, Tools & Applications - January 26, 2015
- Air Quality & Environmental Health: Indoor and Outdoor Impacts - December 21, 2014
Related Articles


Featured Article
Cartography Careers: Map-Making Meets Technology