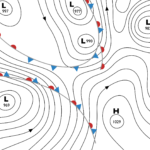
Over 6,000 people became sick and 20 individuals lost their life in 1948 when a cloud of air pollution blanketed the town of Donora, Pennsylvania for 5 days. (1) Donora only had a total population of 14,000! That translates to over 40% of the citizens suffered in some way. The industrial revolution brought progress and hope to many throughout the world but also presented adverse health impacts that realistically could not be foreseen based on the information available at the time. This event and many others like it made it clear there were impacts that needed careful consideration and study in order to avoid them in the future. As such, the Clean Air Act was born in 1963. Initial studies were completed which prompted the revision of the Clean Air Act in 1970 to incorporate air quality standards. The goal was to prevent making air quality worse as well as reduce the frequency and severity of existing pollution.
A total of 6 criteria air pollutants were identified as indicators for air quality along with standards that set the maximum amount of a pollutant which could be released without creating worsening health or environmental conditions. These 6 pollutants became known as the National Ambient Air Quality Standards (NAAQS) and were divided into primary and secondary standards. Primary standards focus on impacts to human health and secondary standards focus on a broader environmental and community impacts. (2) The 6 criteria pollutants are Carbon Monoxide (CO), Nitrogen Dioxide (NOx), Ozone, Lead, Particulate Matter and Sulfur Dioxide (SOx). If an area exceeds the threshold established for the NAAQS then it is designed as being a non-attainment area. Approximately 75.4 million people lived in areas that were in nonattainment for more than one of the criteria pollutants in 2013. (3)
What Are the Criteria Pollutants?
Carbon Monoxide is an odorless gas created from combustion or the process of burning materials. The first standard for CO was established in 1971 and has been revised over time to reflect new information and technology.
Nitrogen Dioxide is a group of chemicals that create gasses which are highly reactive. This means they help create other chemicals or pollutants. Since it is a group of chemicals that have varying molecular structures, they are called NOx where the x changes to a specific number depending on the specific chemical present (e.g. nitrogen dioxide is NO2). Nitrogen Dioxide was chosen as the indicator for the presence of other NOxs.
Ozone is a naturally occurring gas in the upper atmosphere. It becomes a pollutant when it is found at the ground level where it is created through chemical reactions. Specifically, the chemical reaction occurs between NOx and volatile organic compounds (VOCs) when sunlight and heat are present. (4) This pollutant predominately is present during the warmer summer months due to the reliance on the sunlight in order for ozone to be produced.
Lead is a naturally occurring metal and was once added to vehicle fuel that would be released during combustion. It should be noted that aviation fuel still contains lead. Lead is also used during manufacturing processes and smelting plants. (5)
Particulate matter (PM) is a wide grouping of solid and liquid items based on their size. PM includes everything from chemicals to soil. The standards focus on those particles that are 10 micrometers or smaller. To put the size into perspective, the average human hair has a diameter of 70 micrometers. Primary particles come directly from the source such as dirt from a construction site or from a forest fire. Secondary particles are the result of a chemical process such as emissions from plants. (6)
Sulfur Dioxide is representative of a group of reactive sulfuric gasses. SOx is very similar to NOx where the x varies depending on the specific chemical. SOx is generally produced during combustion. (7)
What Are the Major Sources of Ambient Air Pollution?
Air pollution sources are divided into two general groups: point source and nonpoint source. Point sources are the same as primary sources where the pollution is coming from a specific location. Nonpoint sources is where the pollution dissimilates and travels making the actual source difficult to identify such as when wind carries pollution to an area.
There are many sources of air pollution including vehicles, industrial plants, manufacturing plants, dust and volcanic activity. (8) CO primarily comes from vehicular exhaust. Ozone is created from many sources, which makes sense considering it relies on chemical reactions. Some common sources include vehicular exhaust, industrial plants, chemical solvents, some utility plants and gasoline vapors. (4) Lead (Pb) used to come from vehicle exhaust but predominately comes from smelting plants or similar industrial facilities since it was removed from vehicular gasoline during the 1980s. NOx and SOx are produced from vehicle exhaust, industrial plants and power plants. (6)
How Is It Regulated within the United States and Where Is It Located?
The Environmental Protection Agency (EPA) was created during the same period as the Clean Air Act. The EPA is the designated regulatory agency for compliance with the Clean Air Act and established the NAAQS. States are required to develop a State Implementation Plan (SIP) to show how they will maintain compliance with the established standards. If a State is not in compliance (e.g. nonattainment) then their plan has to show progress towards meeting the regulations. EPA will determine if the State meets the standards using the information supplied within the SIP. If the State meets the requirements then they are in attainment. If a State does not meet the standards then they are in nonattainment. (9) If a State is improving then they could be designated as a maintenance area before being classified as in attainment. It should be noted that all SIPs go through a public outreach process to involve the community.
There are multiple monitoring programs established by the EPA to ensure pollutants do not exceed the standards. The air pollution monitoring, ambient air monitoring and enhanced ozone monitoring programs are the most well known to the public. (10) Multiple states have areas that are in nonattainment for one or more of the established NAAQS. Figure 1 shows the nonattainment areas within the United States.
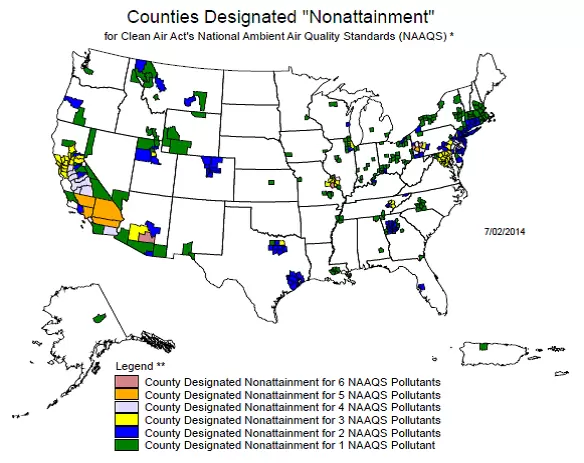
Data Source: https://www.epa.gov/outdoor-air-quality-data/interactive-map-air-quality-monitors
Table 1 depicts which states had nonattainment or maintenance areas and for which criteria pollutants. A total of 27 states included nonattainment areas for ozone, 10 states encompassed nonattainment areas for PM, 16 states had nonattainment areas for SOx, 15 states did not meet the lead standards, 28 states were in nonattainment for CO and 1 state was in nonattainment for NOx. (10)
| Ozone | PM 2.5 | SOx | Lead | CO | NOx | |
| Alabama | X | |||||
| Alaska | X | X | ||||
| Arizona | X | X | X | X | ||
| Arkansas | X | |||||
| California | X | X | X | X | X | |
| Colorado | X | X | ||||
| Connecticut | X | X | ||||
| Delaware | X | X | ||||
| Washington, D.C. | X | X | ||||
| Florida | X | X | ||||
| Georgia | X | |||||
| Idaho | X | X | ||||
| Illinois | X | X | X | |||
| Indiana | X | X | X | X | ||
| Iowa | X | X | ||||
| Kansas | X | |||||
| Kentucky | X | X | ||||
| Louisiana | X | X | ||||
| Maryland | X | X | ||||
| Massachusetts | X | X | ||||
| Michigan | X | X | X | |||
| Minnesota | X | X | ||||
| Mississippi | X | |||||
| Missouri | X | X | X | X | ||
| Montana | X | X | ||||
| Nevada | X | |||||
| New Hampshire | X | X | ||||
| New Jersey | X | X | ||||
| New Mexico | X | |||||
| New York | X | X | ||||
| North Carolina | X | X | ||||
| Ohio | X | X | X | X | ||
| Oregon | X | X | ||||
| Pennsylvania | X | X | X | X | X | |
| South Carolina | X | |||||
| Tennessee | X | X | X | X | X | |
| Texas | X | X | X | |||
| Utah | X | X | ||||
| Virginia | X | X | ||||
| Washington | X | X | ||||
| West Virginia | X | |||||
| Wisconsin | X | X | ||||
| Wyoming | X |
Data Source: http://www.epa.gov/airquality/greenbk/index.html
What Are the Health Impacts?
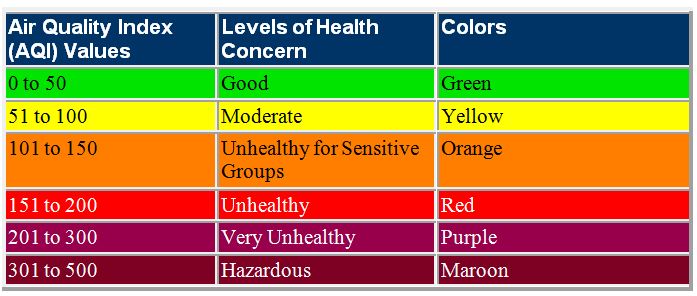
An air quality index (AQI) has been developed to let you know when air quality is less than ideal so you can take the appropriate action to minimize exposure. The AQI has been color coded to provide a visual as well as numerical value as shown below.
Poor air quality can worsen asthma, emphysema and chronic bronchitis. It can increase the frequency and intensity of attacks. The reason is pollutants can cause irritation to the lungs and reduce their function. Ozone has been linked to scarring of lung tissue through repeated exposure. Other physical symptoms of poor air quality include digestive issues, chest pain, dizziness, fever, watery eyes and lethargy. Some pollutants such as CO can worsen heart disease as it can interfere with carrying oxygen in the blood. (11) Lead accumulates within the body and over time can lead to ailments associated with the nervous system, kidney function, immune system, cardiovascular system and developmental disorders. (12) NOx and SOx can cause respiratory problems in as little as 30 minutes for healthy adults. NOx tends to have the highest concentrations along major transportation networks such as roadways, airports and railroads. (13) Particulate matter causes adverse health conditions because they are small enough to be breathed into the lungs where they are trapped or circulated throughout the body. This causes inflammation or can trigger respiratory ailments such as asthma and emphysema. Both NOx and SOx can chemically react to create particulate matter. (14)
The elderly, children and those with medical illnesses are most susceptible to adverse health impacts from poor air quality. They tend to have lower immune systems or spend greater amount of time outside playing. Adults and children experience more absences from school or work when the air quality is substandard. Hospitals also see a rise in the number of people going to the emergency room during bad air quality days. (15)
What Are the Environmental Impacts?
Poor air quality has economic and environmental consequences as well. Poor air quality is a direct cause of reducing the amount of crops produced. This translates to an estimated $500 million dollars worth of crops that could have been grown if there was improved air quality. (16) Pollution reduces tree growth and affects lumber production and forest maturity. Soil contamination of lead and other pollutants can affect functionality of the soil itself and can run off into waterways contaminating food and drinking water. Acid rain is a byproduct of pollution and damages buildings, monuments and other similar structures.
Will Air Quality Improve?
The good news is the air quality is improving. The implementation of the Clean Air Act has had a noticeable effect including the reduction of criteria pollutants by 69% between 1980 and 2013. There has been an 84% decrease in CO since 1980. Lead has decreased by 92%! NOx has an overall reduction of 60% while SOx has seen an 81% reduction. Particulate matter has decreased by 34% since 2000. Ozone has been reduced by a third since 1980. (17) Figures 2 through 9 show the reduction trends. While this improvement is astounding, we still have a long way to go. This should prove beyond a reasonable doubt that it is possible to reverse unintended consequences. We should also be weary of becoming complacent to the success of the Clean Air Act.
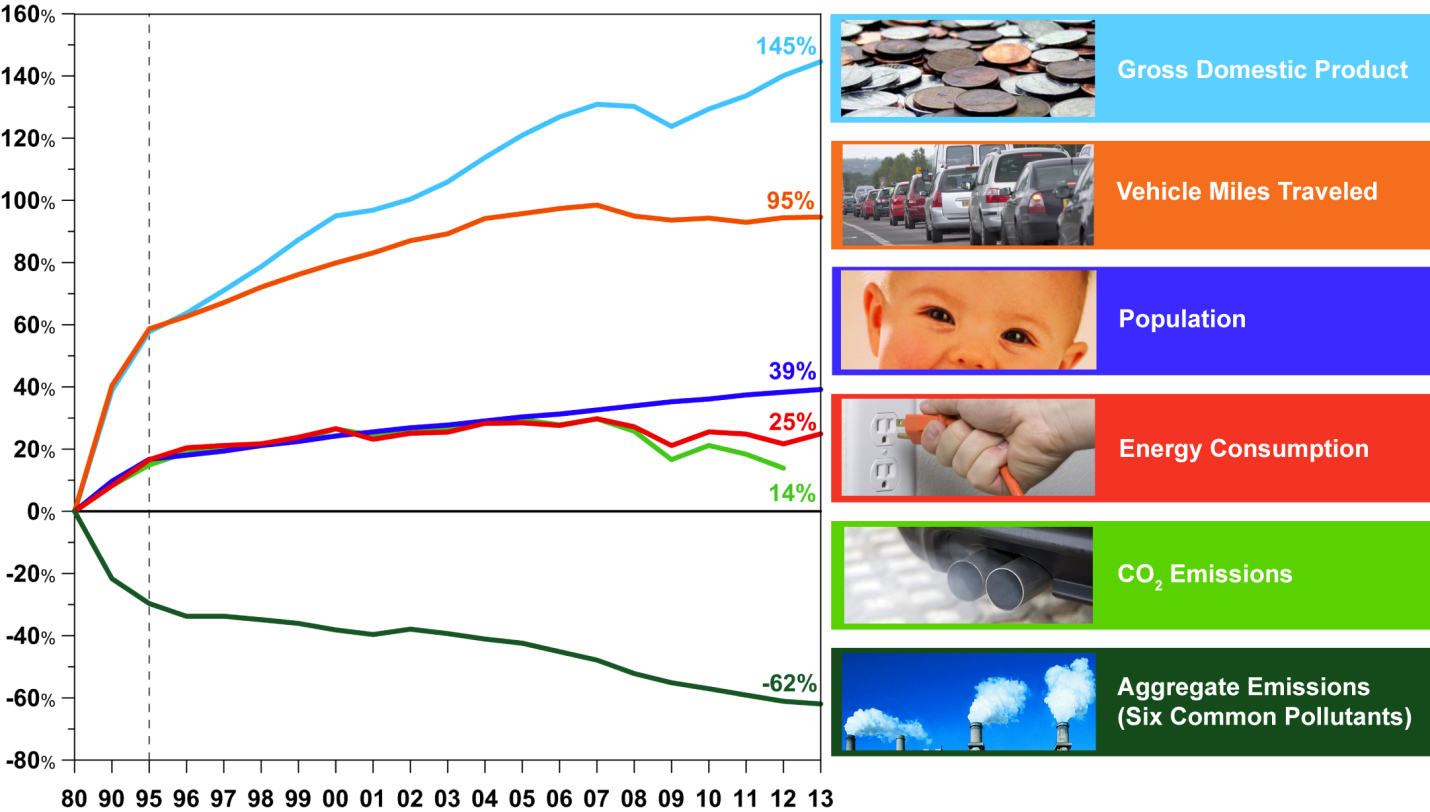
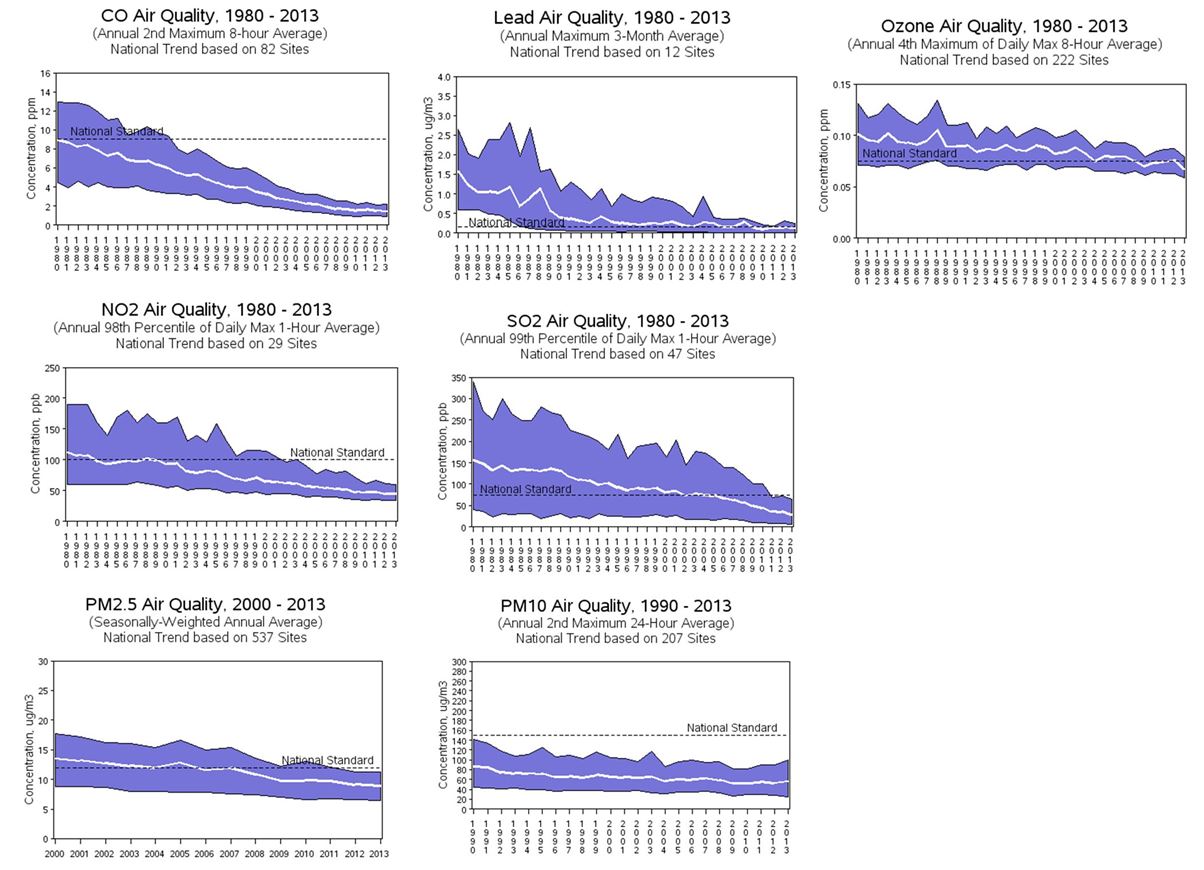
All Graph Data Source: http://www.epa.gov/
EPA implemented numerous programs that lead to these reductions including: clean air interstate rule (CAIR), clean air visibility rule, acid rain program, clean air nonroad diesel rule, clean diesel trucks and bus rule, vehicle emission standards and the great American woodstove changeout. Some were regulatory in nature and some were voluntary programs. (17) There are also more alternative power plants in use than 30 years ago.
What Can I Do to Avoid Contributing to Poor Air Quality? What Should I Do When the Air Quality Is Bad?
Adjust your day to avoid being outdoors if the AQI is in the orange or worse (e.g. unhealthy to hazardous). Work with your local school system to make sure indoor recess is implemented during these days. There are some things you can do that can help make the air a little easier to breathe. These include:
- Fill up your car in the late evening and do not top off your tank on bad air quality days.
- Maintain your car including regular oil changes and checking the tire pressure.
- Avoid revving the car engine and letting it idle for more than 5 minutes.
- Reduce the amount you use your car. Walk, bike, use transit or carpool if available.
- Plan your route and run multiple errands at once.
- Upgrade to energy efficient appliances.
- Conserve energy such as turning off lights when you are not in the room or using energy efficient light bulbs.
- Use electric or solar lawn equipment rather than gas powered.
- Avoid mowing your lawn during the heat of the day.
- Replace wood stoves with HVAC systems. Minimize use of wood burning fireplaces.
- Avoid burning leaves or trash.
- Become involved in the planning process. Contact your local city, county or MPO government agency.
Sources
- http://www.epa.gov/airquality/cleanair.html
- http://www.epa.gov/airquality/greenbk/index.html
- http://www2.epa.gov/lead
- http://www.epa.gov/airquality/sulfurdioxide/
- http://www.epa.gov/airquality/cleanair.html
- http://www.epa.gov/airquality/urbanair/sipstatus/
- https://www.epa.gov/air-trends/
- http://www2.epa.gov/nutrientpollution/where-occurs-air
- http://www.lung.org/associations/charters/mid-atlantic/air-quality/outdoor-air-quality.html
- http://www.lung.org/associations/charters/mid-atlantic/air-quality/outdoor-air-quality.html
- Cultural Resources 101: Part of the Federal Environmental Process - March 8, 2015
- Introduction to Environmental Finance - January 26, 2015
- Indoor Air Quality and Environmental Health - December 21, 2014
Related Articles
Featured Article

Conservation: History and Future


