

Solar energy converts sunlight into electricity through photovoltaic cells or solar thermal systems. Its main advantages include zero emissions and solar costs are now well below those of new coal and natural gas plants. The key drawback is intermittency — no generation at night — and upfront installation cost, though the 30% federal Investment Tax Credit now brings most residential systems well below $20,000.
Solar power has undergone a remarkable transformation in the past decade. What was once an expensive, niche technology is now the cheapest source of new electricity generation on Earth. In 2024, solar accounted for roughly 7% of all US electricity — up from less than 1% ten years ago — and global installed capacity crossed 1,800 gigawatts for the first time. Whether you're exploring sustainability and renewable energy as a field of study or simply trying to understand how solar works, this guide covers the technology, the economics, and where the industry is headed.
With an estimated 173,000 terawatts of solar energy continuously striking Earth's surface, there's far more potential than the world could ever consume. The challenge — and the ongoing innovation story — is collecting it efficiently and affordably.
Solar Power Technology
 Solar energy is primarily collected in one of two ways: photovoltaic solar cells and solar thermal systems.
A photovoltaic (PV) cell is essentially a semiconductor connected to two electrical contacts. Photons from the sun are absorbed into the semiconductor — usually a silicon alloy — and knock loose electrons. Those electrons travel through the material, creating an electrical current. This is the technology behind the panels you see on rooftops and in large utility-scale installations across the country.
Solar thermal systems work differently. They use giant mirrors to reflect and concentrate the sun's rays to heat a fluid, which produces steam to drive a turbine and generate electricity. These systems are typically found in large utility-scale plants in desert regions where direct sunlight is intense and consistent.
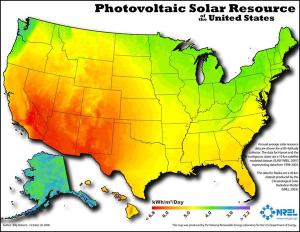
Both methods require substantial sunlight. The amount of solar radiation reaching a panel varies depending on latitude, time of day, season, and atmospheric conditions like clouds, humidity, and air pollution. This is why the dry mid-latitudes — including the US Southwest — hold the greatest solar potential. For those interested in the technical side of energy systems, environmental engineering careers often involve designing and optimizing large-scale renewable infrastructure projects like these.
The same principle applies within the United States. The Southwest has the highest solar potential due to its dry climate and low latitude, but improved panel efficiency and falling costs have made solar economically viable across virtually every region of the country.
Solar Power Pros and Cons
Solar power is a renewable source of energy that can be collected practically anywhere in the world. Here's an honest look at where it excels and where real limitations remain.
| Advantages | Disadvantages |
|---|---|
| Zero air, water, or noise pollution during operation | No electricity generation at night unless paired with storage; output varies by season and weather |
| Zero greenhouse gas emissions after installation | High upfront installation cost (~$17,000–$18,500 after federal Investment Tax Credit for a typical 8 kW system) |
| Lower cost than coal and natural gas for new electricity generation | Large-scale plants can disturb local ecosystems due to land requirements |
| Extremely low operating costs once installed — sunlight is free | Battery storage adds meaningful cost for off-grid or backup power |
| 30% federal Investment Tax Credit significantly reduces installation costs | Commercial panels convert 20–24% of sunlight to electricity, though this is improving steadily |
Solar power plants produce no air, water, or noise pollution and emit no greenhouse gases during operation. Large-scale installations can disturb local plant and wildlife due to their land requirements, but their overall environmental footprint is substantially lower than fossil fuel alternatives. Once built, operating costs are minimal since the fuel — sunlight — is free.
The cost picture has changed completely since 2013. When this article was first published, solar photovoltaic electricity cost about 11 cents per kilowatt-hour — more expensive than coal at 9 cents or natural gas at 6 cents. Today that relationship has reversed entirely. According to Lazard's 2024 Levelized Cost of Energy analysis, average US utility-scale solar runs approximately 6.1 cents per kilowatt-hour, compared to roughly 18.2 cents for new-build coal and about 7.6 cents for natural gas combined-cycle plants. Globally, IRENA's 2024 data puts average solar costs at just 4.3 cents — a 90% reduction since 2010. The EIA's Annual Energy Outlook 2025 no longer even models new coal construction in the United States.
For homeowners, a typical 8 kW residential system costs approximately $24,000–$26,400 before incentives, according to NREL's Q1 2024 benchmark. The 30% federal Investment Tax Credit under the Inflation Reduction Act brings that to roughly $17,000–$18,500 out of pocket. Per-watt prices have actually fallen 65% since 2010, but homeowners now install larger systems — today's average is 7–8 kW rather than the 5–6 kW typical a decade ago — reflecting higher household electricity demand.
Intermittency remains a real challenge. Solar panels can't generate electricity at night, and output varies significantly with weather and season. Battery storage technology is improving rapidly but adds meaningful cost. Grid integration and energy storage are among the most active areas of research and infrastructure investment in the energy industry today.
Solar Capacity: Where the World Stands Today
The global solar landscape has transformed beyond recognition since 2013. Total worldwide installed solar PV capacity reached 1,865 GW at the end of 2024, and the world added 452 GW of new solar in 2024 alone — a 32% increase over the prior year. China now commands nearly half of all global capacity.
| Rank | Country | Installed Capacity (GW) | Year-over-Year Growth |
|---|---|---|---|
| 1 | China | 887.9 | +45.6% |
| 2 | United States | 177.5 | +27.5% |
| 3 | India | 97.4 | +33.7% |
| 4 | Japan | 91.6 | +2.8% |
| 5 | Germany | 89.9 | +20.1% |
| 6 | Brazil | 53.1 | +40.0% |
| 7 | Australia | 38.6 | +20.9% |
| 8 | Spain | 38.5 | +15.6% |
| 9 | Italy | 36.0 | +22.7% |
| 10 | South Korea | 26.7 | +13.5% |
Source: Ember / Energy Institute Statistical Review of World Energy 2025. Data year: 2024 (AC basis).
China alone accounts for roughly 48% of all global solar capacity — a lead that reflects both its dominant manufacturing base and aggressive domestic deployment targets. India overtook Japan in 2024 to claim third place, and Brazil's 40% growth rate made it the fastest-expanding major solar market outside China. In the United States, solar generated approximately 303 TWh of electricity in 2024, surpassing hydropower generation for the first time in US history.
Future Outlook for Solar Energy
 The near-term trajectory for solar is clear: continued rapid growth, declining costs, and a deepening role in the global electricity mix. The main questions are about pace, not direction.
Panel efficiency continues to improve steadily. Commercial panels now reach 20–22% efficiency as a standard baseline, with mainstream high-end models using TOPCon or heterojunction technology reaching 22–24%. The best commercially available panels have broken the 25% barrier. Emerging perovskite-silicon tandem cells are opening a pathway to efficiencies above 30%, with laboratory cells already achieving 34.85% under NREL certification.
In the United States, SEIA and Wood Mackenzie project 246 GW of new solar deployments from 2025 to 2030 — roughly 40–50 GW per year — which would bring cumulative US capacity to approximately 400–450 GW by 2030. The EIA's Short-Term Energy Outlook forecasts approximately 70 GW of new solar coming online in 2026 and 2027 alone. Surging electricity demand from data centers and AI infrastructure, with over 160 GW of new large-load requests tracked by utilities, provides a strong demand signal for clean power. Policy uncertainty around tariffs and potential federal tax credit changes introduces meaningful risk to those projections.
For students considering a role in this transformation, the opportunities are substantial. Careers in solar engineering span design, installation, grid integration, and materials research — and demand for qualified professionals is growing faster than supply. More broadly, green energy careers represent one of the fastest-growing segments of the US economy, with roles in engineering, environmental science, policy, and project management all expanding alongside renewable capacity.
Frequently Asked Questions
How efficient are solar panels today?
Commercial panels now reach 20–22% efficiency as a standard baseline, with high-end models reaching 22–24%. The best commercially available panels have exceeded 25%. This represents a significant improvement from a decade ago, when 20% was considered a ceiling rather than a baseline. Laboratory cells using perovskite-silicon tandem technology have achieved over 34% efficiency, pointing toward further gains in the coming years.
Is solar energy now cheaper than coal and natural gas?
Yes — and by a substantial margin for new-build generation. According to Lazard's 2024 Levelized Cost of Energy analysis, new-build coal costs approximately 18.2 cents per kilowatt-hour in the US, while utility-scale solar averages about 6.1 cents. Natural gas combined-cycle plants run around 7.6 cents. Globally, IRENA's 2024 data puts average solar PV cost at 4.3 cents — 90% below its 2010 level. The EIA's Annual Energy Outlook 2025 no longer models new coal construction in the US at all.
What are the main disadvantages of solar energy?
Solar energy's primary limitations are intermittency and upfront installation cost. Panels generate no electricity at night and produce reduced output on cloudy days or in winter, requiring grid storage or backup power for a consistent supply. For homeowners, a typical 8 kW system costs $24,000–$26,400 before the 30% federal Investment Tax Credit, which reduces net costs to approximately $17,000–$18,500 for most homeowners. Large-scale solar installations also require significant land, which can affect local ecosystems.
How much of the US electricity supply comes from solar?
As of 2024, solar accounts for approximately 7% of total US electricity generation — combining utility-scale and rooftop solar — up from less than 1% a decade ago. Solar surpassed hydropower as an electricity source for the first time in 2024, generating about 303 TWh. Preliminary 2025 data suggests solar's share is already approaching 8.5%, with projections pointing toward 15–20% of US electricity by 2030.
What is the difference between photovoltaic and solar thermal energy?
Photovoltaic (PV) systems convert sunlight directly into electricity using semiconductor cells — this is the technology behind rooftop panels and most utility-scale solar farms. Solar thermal systems use mirrors to concentrate sunlight and heat a fluid, which then drives a steam turbine to generate electricity. PV is the more widely adopted and rapidly advancing technology today, responsible for the dramatic cost declines seen over the past decade. Solar thermal is primarily used in large utility-scale plants in very sunny, arid regions.
Key Takeaways
- Solar Is Now the Cheapest Electricity Source: Utility-scale solar averages about 6.1 cents per kilowatt-hour in the US — well below new-build coal at 18.2 cents and competitive with or cheaper than natural gas combined-cycle plants.
- US Solar Has Grown Sevenfold: Solar now provides approximately 7% of US electricity generation, up from less than 1% a decade ago, and surpassed hydropower generation for the first time in 2024.
- Panel Efficiency Has Improved Significantly: Commercial panels now reach 20–22% efficiency as a standard baseline, with high-end panels reaching 22–24%, and the best commercial products exceeding 25%.
- Upfront Cost Remains the Main Residential Barrier: A typical 8 kW residential system costs $24,000–$26,400 before incentives, though the 30% federal Investment Tax Credit under the Inflation Reduction Act reduces this to approximately $17,000–$18,500 for most homeowners.
- Global Capacity Has Exploded: Total worldwide installed solar PV capacity reached 1,865 GW at the end of 2024 — with China alone accounting for nearly half — and the world added 452 GW of new capacity in 2024, a 32% increase over the prior year.
Interested in a career powered by the sun? Explore what it takes to become a solar engineer and discover the environmental science degree programs that can get you there.

- Nuclear Energy: How It Works, Environmental Impact & Career Paths - December 1, 2014
- Wind Power 101 - November 30, 2014
- Natural Gas 101: Pros, Cons & Career Guide - October 24, 2014
Related Articles


Featured Article

Environmental Science Scholarships for Underrepresented Students